MQL5中交易策略的自动化实现(第六部分):掌握智能资金交易中的订单块(Order Block)检测技巧
概述
在前一篇文章(本系列第五部分)中,我们开发了自适应交叉相对强弱指数(RSI)交易套件策略,该策略将移动平均线交叉与RSI过滤相结合,以识别高概率的交易机会。现在,在第六部分中,我们将聚焦于纯粹的价格行为分析,在MQL5(一种常用于聪明资金交易的强大工具)中实现一个自动化的订单块检测系统 。该策略能够识别关键的机构订单块——即大型交易者累积或派发头寸的区域——从而帮助交易者预测潜在的反转和趋势延续。
与传统指标不同,这种方法完全依赖于价格结构,根据历史价格行为动态检测多头和空头订单块。该系统会直接在图表上可视化这些区域,为交易者提供清晰的市场背景和潜在的交易机会。在本文中,我们将逐步介绍该策略的开发过程,从定义订单块到在MQL5中的实现,再到回测其有效性并分析其表现。我们将通过以下部分来展开讨论:
- 策略设计方案
- 在MQL5中的实现
- 回测
- 结论
到文章结尾时,您将具备自动化订单块检测的坚实基础,能够把聪明资金理念融入您的交易算法之中。让我们开始吧。
策略设计方案
我们将首先识别盘整区间,即价格在无明显趋势方向的情况下在一个有限范围内波动的情况。为此,我们将在市场中扫描价格走势缺乏显著突破的区域。一旦我们检测到价格从这个区间突破,我们将评估是否可以形成订单块。我们的验证过程将涉及检查突破发生前的三根K线。如果这些K线表现出强劲的推动走势,我们将根据突破方向把订单块归类为多头或空头。当向上突破时,我们将识别出多头订单块;而当向下突破时,我们将标记为空头订单块。一旦验证成功,我们将在图表上标出订单块,以供之后参考。具体示例如下:
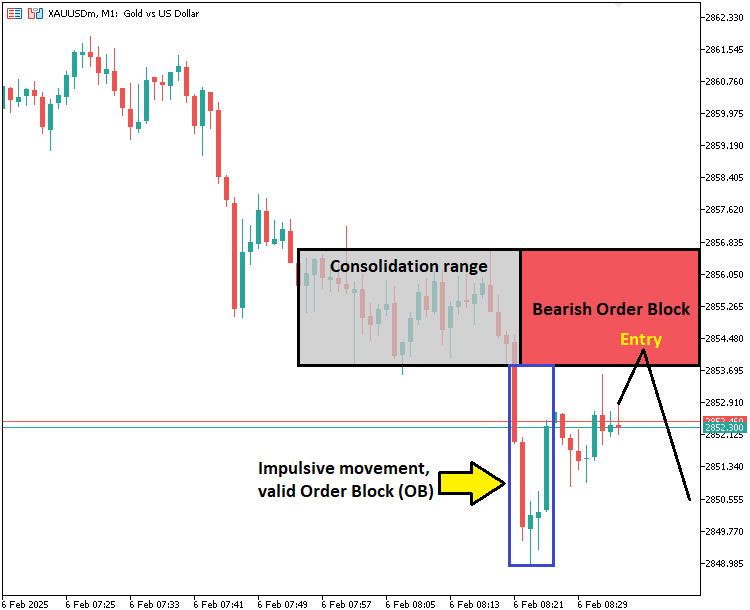
如果前方的三根K线未展现出强劲的推动走势,我们将不会确认订单块的有效性。相反,我们仅会绘制出盘整区间,以确保不会标记出那些薄弱或无关紧要的区域。在标记出有效的订单块之后,我们将持续监控价格走势。如果价格回撤至先前已确认有效的订单块区域,我们将按照初始突破方向执行交易,预期趋势将持续。然而,如果某个订单块的范围超出了最后一个显著的价格点,我们会将其从有效订单块数组中移除,以确保仅交易那些相关且较新的区域。这种结构化的方法将有助于我们专注于高概率的交易机会,过滤掉那些弱势的突破,并确保交易与聪明资金的动向保持一致。
在MQL5中的实现
要在MQL5中实现订单块的识别功能,我们需要定义一些在整个过程中必需的全局变量。
#include <Trade/Trade.mqh> CTrade obj_Trade; // Struct to hold both the price and the index of the high or low struct PriceIndex { double price; int index; }; // Global variables to track the range and breakout state PriceIndex highestHigh = {0, 0}; // Stores the highest high of the range PriceIndex lowestLow = {0, 0}; // Stores the lowest low of the range bool breakoutDetected = false; // Tracks if a breakout has occurred double impulseLow = 0.0; double impulseHigh = 0.0; int breakoutBarIndex = -1; // To track the bar at which breakout occurred datetime breakoutTime = 0; // To store the breakout time string totalOBs_names[]; datetime totalOBs_dates[]; bool totalOBs_is_signals[]; #define OB_Prefix "OB REC " #define CLR_UP clrLime #define CLR_DOWN clrRed bool is_OB_UP = false; bool is_OB_DOWN = false;
我们首先引入"Trade.mqh"库,并创建一个"CTrade"对象"obj_Trade",用于处理交易执行。我们定义了一个"PriceIndex" 结构体,用于存储价格水平及其对应的索引,这有助于我们追踪盘整区间内的最高价和最低价。全局变量"highestHigh"和"lowestLow"用于存储这些关键水平位,而"breakoutDetected"标识则用于指示是否发生了突破。
为了验证是否存在强劲的推动走势,我们引入了"impulseLow"和"impulseHigh"变量,它们将有助于判断突破的强度。变量"breakoutBarIndex"用于追踪突破发生的具体K线位置,而"breakoutTime"则存储对应的时间戳。对于订单块管理,我们维护三个全局数组:"totalOBs_names"、"totalOBs_dates"和"totalOBs_is_signals"。这些数组分别存储订单块的名称、各自的时间戳,以及是否为有效的交易信号。
我们将订单块前缀定义为"OB_Prefix",并使用"CLR_UP"(浅绿色)表示多头订单块,使用"CLR_DOWN"(红色)表示空头订单块,为它们分配颜色代码。最后,布尔标志"is_OB_UP"和"is_OB_DOWN"帮助我们追踪最后检测到的订单块是多头还是空头。由于我们希望每次运行时都能从一个全新的状态开始,因此在程序初始化时无需追踪订单块。因此,我们将直接在OnTick事件处理器中实现该控制逻辑。
//+------------------------------------------------------------------+ //| Expert ontick function | //+------------------------------------------------------------------+ void OnTick() { static bool isNewBar = false; int currBars = iBars(_Symbol, _Period); static int prevBars = currBars; // Detect a new bar if (prevBars == currBars) { isNewBar = false; } else if (prevBars != currBars) { isNewBar = true; prevBars = currBars; } if (!isNewBar) return; // Process only on a new bar int rangeCandles = 7; // Initial number of candles to check double maxDeviation = 50; // Max deviation between highs and lows in points int startingIndex = 1; // Starting index for the scan int waitBars = 3; //--- }
在OnTick事件处理器中,我们首先通过“currBars”(当前K线数)和“prevBars”(前一K线数)来检测新K线的形成。当出现新K线时,我们将“isNewBar”设为“true”;如果未检测到新K线,则提前返回。接下来,我们将“rangeCandles”定义为“7”,表示我们分析以识别盘整区间所需的最少K线数。“maxDeviation”变量被设为“50”点,用于限制盘整区间内最高价与最低价之间可接受的差值范围。“startingIndex”初始化为“1”,以确保我们从最近一根已完成的K线开始扫描。此外,我们将“waitBars”设为“3”,以定义在验证订单块有效性之前应经过的K线数量。接下来,我们需要检查是否存在盘整区间,并获取相关价格,以便进一步确定有效的订单块。
// Check for consolidation or extend the range if (!breakoutDetected) { if (highestHigh.price == 0 && lowestLow.price == 0) { // If range is not yet established, look for consolidation if (IsConsolidationEqualHighsAndLows(rangeCandles, maxDeviation, startingIndex)) { GetHighestHigh(rangeCandles, startingIndex, highestHigh); GetLowestLow(rangeCandles, startingIndex, lowestLow); Print("Consolidation range established: Highest High = ", highestHigh.price, " at index ", highestHigh.index, " and Lowest Low = ", lowestLow.price, " at index ", lowestLow.index); } } else { // Extend the range if the current bar's prices remain within the range ExtendRangeIfWithinLimits(); } }
每当有新K线形成时,我们都会检查是否出现盘整区间;若未检测到突破,则扩展现有盘整区间范围。如果“highestHigh.price”(最高价)和“lowestLow.price”(最低价)均为0,则表明尚未确立盘整区间。此时,我们调用“IsConsolidationEqualHighsAndLows”函数,检查最近“rangeCandles”根K线是否在允许的“maxDeviation”(最大偏差)范围内形成盘整。如果确认形成盘整,我们则使用“GetHighestHigh”和“GetLowestLow”函数,确定该区间内的确切最高价和最低价,并将这些值及其对应的K线索引存储起来。
如果已确立盘整区间,我们则调用“ExtendRangeIfWithinLimits”函数,确保当前K线仍在定义范围内。该函数有助于在未发生突破的情况下,动态调整盘整区间范围。以下是实现自定义函数的代码段:
// Function to detect consolidation where both highs and lows are nearly equal bool IsConsolidationEqualHighsAndLows(int rangeCandles, double maxDeviation, int startingIndex) { // Loop through the last `rangeCandles` to check if highs and lows are nearly equal for (int i = startingIndex; i < startingIndex + rangeCandles - 1; i++) { // Compare the high of the current candle with the next one if (MathAbs(high(i) - high(i + 1)) > maxDeviation * Point()) { return false; // If the high difference is greater than allowed, it's not a consolidation } // Compare the low of the current candle with the next one if (MathAbs(low(i) - low(i + 1)) > maxDeviation * Point()) { return false; // If the low difference is greater than allowed, it's not a consolidation } } // If both highs and lows are nearly equal, it's a consolidation range return true; }
我们定义了一个布尔型函数“IsConsolidationEqualHighsAndLows”,该函数负责通过验证最近“rangeCandles”根K线的最高价和最低价是否在指定的“maxDeviation”范围内近乎相等,来检测是否存在盘整区间。我们通过从“startingIndex”(起始索引)开始遍历每一根K线,并比较连续K线的最高价和最低价来实现这一功能。
在for循环内部,我们使用MathAbs函数计算当前K线最高价("high(i)")与下一根K线最高价之间的绝对差值。若该差值超过转换为点值形式的最大偏差(Point),,函数将立即返回false,表明这些最高价之间的差异过大,不足以构成盘整区间。同样地,我们再次使用MathAbs函数比较连续两根K线的最低价("low(i)"和"low(i + 1)"),确保最低价也处于允许的偏差范围内。如果有任何一项检查未通过,函数将提前退出并返回false。如果所有最高价和最低价均处于可接受的偏差范围内,则返回true,确认存在有效的盘整区间。接下来,我们将定义负责获取最高价和最低价K线价格的函数。
// Function to get the highest high and its index in the last `rangeCandles` candles, starting from `startingIndex` void GetHighestHigh(int rangeCandles, int startingIndex, PriceIndex &highestHighRef) { highestHighRef.price = high(startingIndex); // Start by assuming the first candle's high is the highest highestHighRef.index = startingIndex; // The index of the highest high (starting with the `startingIndex`) // Loop through the candles and find the highest high and its index for (int i = startingIndex + 1; i < startingIndex + rangeCandles; i++) { if (high(i) > highestHighRef.price) { highestHighRef.price = high(i); // Update highest high highestHighRef.index = i; // Update index of highest high } } } // Function to get the lowest low and its index in the last `rangeCandles` candles, starting from `startingIndex` void GetLowestLow(int rangeCandles, int startingIndex, PriceIndex &lowestLowRef) { lowestLowRef.price = low(startingIndex); // Start by assuming the first candle's low is the lowest lowestLowRef.index = startingIndex; // The index of the lowest low (starting with the `startingIndex`) // Loop through the candles and find the lowest low and its index for (int i = startingIndex + 1; i < startingIndex + rangeCandles; i++) { if (low(i) < lowestLowRef.price) { lowestLowRef.price = low(i); // Update lowest low lowestLowRef.index = i; // Update index of lowest low } } }
“GetHighestHigh”函数负责从“startingIndex”起始的最近“rangeCandles”根K线中,识别出最高价及其对应的索引位置。我们首先将“highestHighRef.price”初始化为该区间内第一根K线的最高价(“high(startingIndex)”),并将“highestHighRef.index”设置为“startingIndex”。接下来,我们遍历该区间内剩余的K线,检查是否存在价格高于当前“highestHighRef.price”的K线。若发现新的最高价,则更新“highestHighRef.price”和“highestHighRef.index”的值。该函数有助于我们确定盘整区间的上边界。
同理,“GetLowestLow”函数用于在相同区间内找出最低价及其索引的位置。我们将“lowestLowRef.price”初始化为“low(startingIndex)”,并将“lowestLowRef.index”初始化为“startingIndex”。在遍历K线的过程中,我们检查是否存在价格低于当前“lowestLowRef.price”的K线。如果存在,我们则更新“lowestLowRef.price”和“lowestLowRef.index”的值。该函数用于确定盘整区间的下边界。最后,我们来介绍用于扩展区间的函数。
// Function to extend the range if the latest bar remains within the range limits void ExtendRangeIfWithinLimits() { double currentHigh = high(1); // Get the high of the latest closed bar double currentLow = low(1); // Get the low of the latest closed bar if (currentHigh <= highestHigh.price && currentLow >= lowestLow.price) { // Extend the range if the current bar is within the established range Print("Range extended: Including candle with High = ", currentHigh, " and Low = ", currentLow); } else { Print("No extension possible. The current bar is outside the range."); } }
这里,通过“ExtendRangeIfWithinLimits”函数确保:如果新K线持续落在先前识别出的盘整区间边界内,则该区间仍保持有效。我们首先使用“high(1)”和“low(1)”函数获取最近一根已收盘K线的最高价和最低价。接下来,我们检查“currentHigh”(当前最高价)是否小于或等于“highestHigh.price”(之前记录的最高价),以及“currentLow”(当前最低价)是否大于或等于“lowestLow.price”(之前记录的最低价)。如果这两个条件均满足,则区间得以扩展,并打印一条确认消息,表明新K线已包含在现有区间内。
反之,如果新K线超出了既定的区间范围,则不进行区间扩展,并打印一条消息,显示该区间无法扩展。该函数在维持有效盘整区间方面发挥着关键的作用,且如果市场价格保持在预设区间内,则可防止误报突破信号。
我们还使用了预定义的函数来获取K线价格数据。以下是这些函数的代码段:
//--- One-line functions to access price data double high(int index) { return iHigh(_Symbol, _Period, index); } double low(int index) { return iLow(_Symbol, _Period, index); } double open(int index) { return iOpen(_Symbol, _Period, index); } double close(int index) { return iClose(_Symbol, _Period, index); } datetime time(int index) { return iTime(_Symbol, _Period, index); }
这些单行函数“high”、“low”、“open”、“close”和“time”是获取历史K线价格数据和时间数据的简单封装函数。每个函数都会调用相应的MQL5内置函数——iHigh、iLow、iOpen、iClose和iTime——以获取指定“索引”位置K线的对应值。其中,“high”函数返回特定K线的最高价,而“low”函数返回最低价。同样,“open”函数用于获取开盘价,“close”函数用于获取收盘价。“time”函数则返回K线的时间戳。我们使用这些函数来提高代码的可读性,并使程序能够以更清晰地、更有条理的方式访问历史数据。
借助这些函数,我们现在就可以通过以下代码段,在盘整区间确立后检查是否发生突破。
// Check for breakout if a consolidation range is established if (highestHigh.price > 0 && lowestLow.price > 0) { breakoutDetected = CheckRangeBreak(highestHigh, lowestLow); }
在此,若已确立盘整区间,我们会再次调用一个名为“CheckRangeBreak”的自定义函数来检查区间是否发生突破,并将结果存储在“breakoutDetected”(突破检测)变量中。实现该函数代码如下:
// Function to check for range breaks bool CheckRangeBreak(PriceIndex &highestHighRef, PriceIndex &lowestLowRef) { double closingPrice = close(1); // Get the closing price of the current candle if (closingPrice > highestHighRef.price) { Print("Range break upwards detected. Closing price ", closingPrice, " is above the highest high: ", highestHighRef.price); return true; // Breakout detected } else if (closingPrice < lowestLowRef.price) { Print("Range break downwards detected. Closing price ", closingPrice, " is below the lowest low: ", lowestLowRef.price); return true; // Breakout detected } return false; // No breakout }
对于布尔型的“CheckRangeBreak”函数,我们会将当前K线的“收盘价”(closingPrice)与“最高价参考值”(highestHighRef.price)和“最低价参考值”(lowestLowRef.price)进行比较。如果“收盘价”高于“最高价参考值”,则判定为向上突破。如果“收盘价”低于“最低价参考值”,则判定为向下突破。在这两种情况下,函数均返回“true”,并打印突破方向。如果以上条件均不满足,则返回“false”。
现在,我们可以利用该变量来检测突破情况,并在需要时重置区间状态,以便为下一个可能的盘整区间做好准备,具体实现如下:
// Reset state after breakout if (breakoutDetected) { Print("Breakout detected. Resetting for the next range."); breakoutBarIndex = 1; // Use the current bar's index (index 1 refers to the most recent completed bar) breakoutTime = TimeCurrent(); impulseHigh = highestHigh.price; impulseLow = lowestLow.price; breakoutDetected = false; highestHigh.price = 0; highestHigh.index = 0; lowestLow.price = 0; lowestLow.index = 0; }
在检测到突破后,我们需要为下一个盘整区间重置相关状态。首先,将“breakoutBarIndex”(突破K线索引)设置为1,以指向最近一根已完成的K线。接着,使用“TimeCurrent”函数将当前时间更新至“breakoutTime”(突破时间)。然后,将“impulseHigh”(脉冲高点)和“impulseLow”(脉冲低点)分别设置为上一个盘整区间的“highestHigh.price”(最高价)和“lowestLow.price”(最低价)。随后,将“breakoutDetected”(突破检测)标记为“false”(未检测到突破),并将“highestHigh”(最高价)和“lowestLow”(最低价)的价格及其索引均重置为0,为下一个盘整区间的检测做好准备。现在,我们可以继续基于脉冲式行情检查有效的订单块。
if (breakoutBarIndex >= 0 && TimeCurrent() > breakoutTime + waitBars * PeriodSeconds()) { DetectImpulsiveMovement(impulseHigh,impulseLow,waitBars,1); bool is_OB_Valid = is_OB_DOWN || is_OB_UP; datetime time1 = iTime(_Symbol,_Period,rangeCandles+waitBars+1); double price1 = impulseHigh; int visibleBars = (int)ChartGetInteger(0,CHART_VISIBLE_BARS); datetime time2 = is_OB_Valid ? time1 + (visibleBars/1)*PeriodSeconds() : time(waitBars+1); double price2 = impulseLow; string obNAME = OB_Prefix+"("+TimeToString(time1)+")"; color obClr = clrBlack; if (is_OB_Valid){obClr = is_OB_UP ? CLR_UP : CLR_DOWN;} else if (!is_OB_Valid){obClr = clrBlue;} string obText = ""; if (is_OB_Valid){obText = is_OB_UP ? "Bullish Order Block"+ShortToString(0x2BED) : "Bearish Order Block"+ShortToString(0x2BEF);} else if (!is_OB_Valid){obText = "Range";} //--- }
这里,我们首先检查“breakoutBarIndex”是否大于或等于0,并确认当前时间是否已超过“breakoutTime”加上一个等待周期。该等待周期通过将“waitBars”(等待K线数量)乘以每根K线对应的秒数(使用PeriodSeconds函数)来计算。如果满足上述条件,我们将调用“DetectImpulsiveMovement”函数,以识别市场中的脉冲式行情。调用时,需传入“impulseHigh”、“impulseLow”、“waitBars”以及一个固定参数1。
随后,我们通过检查“is_OB_DOWN”(看跌订单块)或“is_OB_UP”(看涨订单块)是否为真来验证订单块的有效性,并将结果存储在“is_OB_Valid”(订单块是否有效)变量中。我们使用iTime函数获取特定K线的时间戳(该函数返回指定品种和周期下特定K线的时间),并将其存储在“time1”变量中。该K线的价格存储在“impulseHigh”中,供后续计算使用。接下来,我们使用ChartGetInteger函数(参数为CHART_VISIBLE_BARS)获取图表上可见的K线数量,该函数返回图表上当前可见的K线总数。然后,我们根据订单块是否有效来计算“time2”(第二个时间点)。若“is_OB_Valid”为true,我们将“time1”加上可见K线数量乘以周期秒数,从而调整时间。否则,我们使用“time(waitBars+1)”确定下一根K线的时间。通过使用三元运算符来实现条件判断。
将“price2”变量设置为“impulseLow”。接下来,我们使用“OB_Prefix”(订单块前缀)以及TimeToString函数(将时间转换为字符串格式)生成订单块名称。订单块的颜色通过“obClr”变量设置,默认颜色为黑色。如果订单块有效,我们将颜色设置为“CLR_UP”(看涨订单块颜色)或“CLR_DOWN”(看跌订单块颜色)。如果订单块无效,则将颜色设置为蓝色。
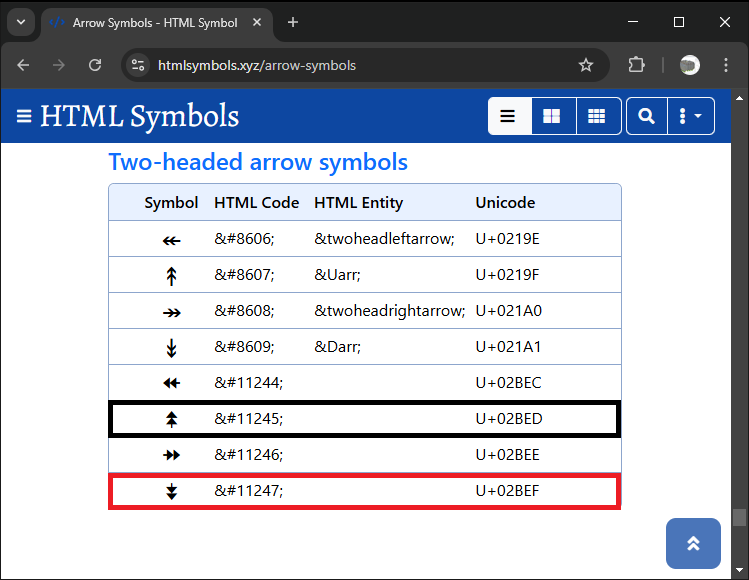
订单块文本存储在“obText”变量中,其内容根据订单块方向设置。如果订单块有效,我们显示“看涨订单块”或“看跌订单块”,并附带唯一的Unicode字符编码(看涨为0x2BED,看跌为0x2BEF),这些编码通过“ShortToString”函数进行转换。如果订单块无效,则标记为“区间”。这些Unicode符号如下:
检测脉冲式行情的函数如下:
// Function to detect impulsive movement after breakout void DetectImpulsiveMovement(double breakoutHigh, double breakoutLow, int impulseBars, double impulseThreshold) { double range = breakoutHigh - breakoutLow; // Calculate the breakout range double impulseThresholdPrice = range * impulseThreshold; // Threshold for impulsive move // Check for the price movement in the next `impulseBars` bars after breakout for (int i = 1; i <= impulseBars; i++) { double closePrice = close(i); // Get the close price of the bar // Check if the price moves significantly beyond the breakout high if (closePrice >= breakoutHigh + impulseThresholdPrice) { is_OB_UP = true; Print("Impulsive upward movement detected: Close Price = ", closePrice, ", Threshold = ", breakoutHigh + impulseThresholdPrice); return; } // Check if the price moves significantly below the breakout low else if (closePrice <= breakoutLow - impulseThresholdPrice) { is_OB_DOWN = true; Print("Impulsive downward movement detected: Close Price = ", closePrice, ", Threshold = ", breakoutLow - impulseThresholdPrice); return; } } // If no impulsive movement is detected is_OB_UP = false; is_OB_DOWN = false; Print("No impulsive movement detected after breakout."); }
在该函数中,为检测突破后价格是否出现脉冲式行情,我们首先通过“breakoutHigh”(突破高点)减去“breakoutLow" (突破低点)”计算出“range”(波动区间)。“脉冲阈值价格”(impulseThresholdPrice)通过将波动区间乘以“脉冲阈值”(impulseThreshold)来确定,该值定义了价格需达到的波动幅度,用作判定脉冲式行情。随后,我们使用for循环检查后续“脉冲K线数”(impulseBars)根K线内的价格走势。
对于每根K线,我们使用“close(i)”函数获取其"收盘价",该函数用于检索第i根K线的收盘价。若某根K线的收盘价超过“突破高点”的最小幅度达到了“脉冲阈值价格”,则判定为脉冲式上涨行情,将“is_OB_UP”设置为true,并打印检测到的上涨行情。同理,若某根K线的收盘价低于“突破低点”的最小幅度达到了“脉冲阈值价格”,则判定为脉冲式下跌行情,将“is_OB_DOWN”设置为true,并打印检测结果。
如果检查完所有K线后未发现显著价格波动,则将“is_OB_UP”和“is_OB_DOWN”均设置为false,并打印未检测到脉冲式行情的信息。现在,我们可以按照以下方式在图表上绘制波动区间以及订单块:
if (!is_OB_Valid){ if (ObjectFind(0,obNAME) < 0){ CreateRec(obNAME,time1,price1,time2,price2,obClr,obText); } } else if (is_OB_Valid){ if (ObjectFind(0,obNAME) < 0){ CreateRec(obNAME,time1,price1,time2,price2,obClr,obText); Print("Old ArraySize = ",ArraySize(totalOBs_names)); ArrayResize(totalOBs_names,ArraySize(totalOBs_names)+1); Print("New ArraySize = ",ArraySize(totalOBs_names)); totalOBs_names[ArraySize(totalOBs_names)-1] = obNAME; ArrayPrint(totalOBs_names); Print("Old ArraySize = ",ArraySize(totalOBs_dates)); ArrayResize(totalOBs_dates,ArraySize(totalOBs_dates)+1); Print("New ArraySize = ",ArraySize(totalOBs_dates)); totalOBs_dates[ArraySize(totalOBs_dates)-1] = time2; ArrayPrint(totalOBs_dates); Print("Old ArraySize = ",ArraySize(totalOBs_is_signals)); ArrayResize(totalOBs_is_signals,ArraySize(totalOBs_is_signals)+1); Print("New ArraySize = ",ArraySize(totalOBs_is_signals)); totalOBs_is_signals[ArraySize(totalOBs_is_signals)-1] = false; ArrayPrint(totalOBs_is_signals); } } breakoutBarIndex = -1; // Use the current bar's index (index 1 refers to the most recent completed bar) breakoutTime = 0; impulseHigh = 0; impulseLow = 0; is_OB_UP = false; is_OB_DOWN = false;
在此,我们首先检查订单块(“is_OB_Valid”)是否有效。若订单块无效,则使用ObjectFind函数检查图表上是否已存在名为“obNAME”的对象。如果未找到该对象(函数返回负值),则调用“CreateRec”函数,根据提供的时间、价格、颜色和文本等参数,在图表上创建订单块图形对象。
如果订单块有效,那么我们会再次检查图表上是否已存在对应的图形对象。如果对象不存在,则先创建该订单块图形,随后通过ArrayResize函数调整三个数组的大小:"totalOBs_names"用于存储订单块名称;"totalOBs_dates"用于存储时间戳;"totalOBs_is_signals"用于标记每个订单块是否为有效信号(初始值设置为false)。调整数组大小后,使用ArraySize函数打印旧数组与新数组的大小,并通过ArrayPrint函数显示数组内容。最后,我们重置突破状态:将"breakoutBarIndex"设置为-1;"breakoutTime"、"impulseHigh"和"impulseLow"重置为0;订单块方向标识"is_OB_UP"和"is_OB_DOWN"设置为false。
为了创建附带文本的矩形图形,我们使用自定义函数"CreateRec",其实现如下:
void CreateRec(string objName,datetime time1,double price1, datetime time2,double price2,color clr,string txt){ if (ObjectFind(0,objName) < 0){ ObjectCreate(0,objName,OBJ_RECTANGLE,0,time1,price1,time2,price2); Print("SUCCESS CREATING OBJECT >",objName,"< WITH"," T1: ",time1,", P1: ",price1, ", T2: ",time2,", P2: ",price2); ObjectSetInteger(0,objName,OBJPROP_TIME,0,time1); ObjectSetDouble(0,objName,OBJPROP_PRICE,0,price1); ObjectSetInteger(0,objName,OBJPROP_TIME,1,time2); ObjectSetDouble(0,objName,OBJPROP_PRICE,1,price2); ObjectSetInteger(0,objName,OBJPROP_FILL,true); ObjectSetInteger(0,objName,OBJPROP_COLOR,clr); ObjectSetInteger(0,objName,OBJPROP_BACK,false); // Calculate the center position of the rectangle datetime midTime = time1 + (time2 - time1) / 2; double midPrice = (price1 + price2) / 2; // Create a descriptive text label centered in the rectangle string description = txt; string textObjName = objName + description; // Unique name for the text object if (ObjectFind(0, textObjName) < 0) { ObjectCreate(0, textObjName, OBJ_TEXT, 0, midTime, midPrice); ObjectSetString(0, textObjName, OBJPROP_TEXT, description); ObjectSetInteger(0, textObjName, OBJPROP_COLOR, clrBlack); ObjectSetInteger(0, textObjName, OBJPROP_FONTSIZE, 15); ObjectSetInteger(0, textObjName, OBJPROP_ANCHOR, ANCHOR_CENTER); Print("SUCCESS CREATING LABEL >", textObjName, "< WITH TEXT: ", description); } ChartRedraw(0); } }
在已定义的 "CreateRec" 函数中,我们首先通过ObjectFind函数检查名为 "objName" 的图形对象是否已存在于图表上。如果对象不存在,则执行以下操作:使用ObjectCreate函数创建一个矩形图形(类型为OBJ_RECTANGLE),并指定其时间与价格坐标;通过ObjectSetInteger和ObjectSetDouble函数设置矩形的属性(如颜色、填充、可见性等)。计算矩形的中心位置,并在该位置创建一个文本标签(类型为OBJ_TEXT),同时设置标签的属性(文本内容、颜色、字号、锚点等)。最后,我们调用ChartRedraw 函数更新图表显示。如果对象或标签已存在,则不执行任何操作。
完成订单块的绘制后,我们可以进一步判断价格是否回测订单块范围,并在价格进入或突破该范围时触发开仓操作。
for (int j=ArraySize(totalOBs_names)-1; j>=0; j--){ string obNAME = totalOBs_names[j]; bool obExist = false; //Print("name = ",fvgNAME," >",ArraySize(totalFVGs)," >",j); //ArrayPrint(totalFVGs); //ArrayPrint(barTIMES); double obHigh = ObjectGetDouble(0,obNAME,OBJPROP_PRICE,0); double obLow = ObjectGetDouble(0,obNAME,OBJPROP_PRICE,1); datetime objTime1 = (datetime)ObjectGetInteger(0,obNAME,OBJPROP_TIME,0); datetime objTime2 = (datetime)ObjectGetInteger(0,obNAME,OBJPROP_TIME,1); color obColor = (color)ObjectGetInteger(0,obNAME,OBJPROP_COLOR); if (time(1) < objTime2){ //Print("FOUND: ",obNAME," @ bar ",j,", H: ",obHigh,", L: ",obLow); obExist = true; } double Ask = NormalizeDouble(SymbolInfoDouble(_Symbol,SYMBOL_ASK),_Digits); double Bid = NormalizeDouble(SymbolInfoDouble(_Symbol,SYMBOL_BID),_Digits); if (obColor == CLR_UP && Ask > obHigh && close(1) > obHigh && open(1) < obHigh && !totalOBs_is_signals[j]){ Print("BUY SIGNAL For (",obNAME,") Now @ ",Ask); double sl = Bid - 1500*_Point; double tp = Bid + 1500*_Point; obj_Trade.Buy(0.01,_Symbol,Ask,sl,tp); totalOBs_is_signals[j] = true; ArrayPrint(totalOBs_names,_Digits," [< >] "); ArrayPrint(totalOBs_is_signals,_Digits," [< >] "); } else if (obColor == CLR_DOWN && Bid < obLow && close(1) < obLow && open(1) > obLow && !totalOBs_is_signals[j]){ Print("SELL SIGNAL For (",obNAME,") Now @ ",Bid); double sl = Ask + 1500*_Point; double tp = Ask - 1500*_Point; obj_Trade.Sell(0.01,_Symbol,Bid,sl,tp); totalOBs_is_signals[j] = true; ArrayPrint(totalOBs_names,_Digits," [< >] "); ArrayPrint(totalOBs_is_signals,_Digits," [< >] "); } if (obExist == false){ bool removeName = ArrayRemove(totalOBs_names,0,1); bool removeTime = ArrayRemove(totalOBs_dates,0,1); bool remove_isSignal = ArrayRemove(totalOBs_is_signals,0,1); if (removeName && removeTime && remove_isSignal){ Print("Success removing the OB DATA from arrays. New Data as below:"); Print("Total Sizes => OBs: ",ArraySize(totalOBs_names),", TIMEs: ",ArraySize(totalOBs_dates),", SIGNALs: ",ArraySize(totalOBs_is_signals)); ArrayPrint(totalOBs_names); ArrayPrint(totalOBs_dates); ArrayPrint(totalOBs_is_signals); } } }
这里,我们通过 循环遍历"totalOBs_names"数组,逐个处理每个订单块(标记为"obNAME")。我们使用ObjectGetDouble和ObjectGetInteger函数,获取订单块的最高价、最低价、时间戳以及颜色属性。检查当前时间是否早于订单块的结束时间。如果时间条件满足,则根据订单块的颜色和价格条件,进一步判断是否产生买入或卖出信号。如果上述条件成立,调用"obj_Trade.Buy"或"obj_Trade.Sell"函数执行交易,同时更新"totalOBs_is_signals"数组,标记该订单块已触发信号(避免价格回撤时重复交易)。
如果订单块未满足时间条件,则使用ArrayRemove函数将其从"totalOBs_names"、"totalOBs_dates"和"totalOBs_is_signals"数组中移除。如果删除操作成功,则打印更新后的数组大小及内容。至此,我们已达成关键里程碑。
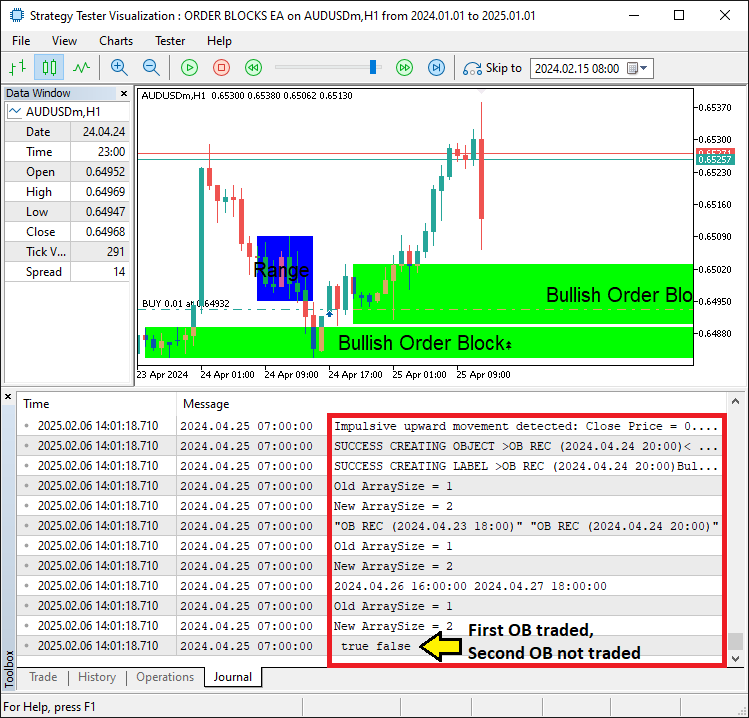
从图像中可以看出,订单块已被成功识别并且完成了交易,达到了我们的既定目标。目前仅需对程序进行回测,并分析其实际表现。相关内容将在下一节展开说明。
回测与优化
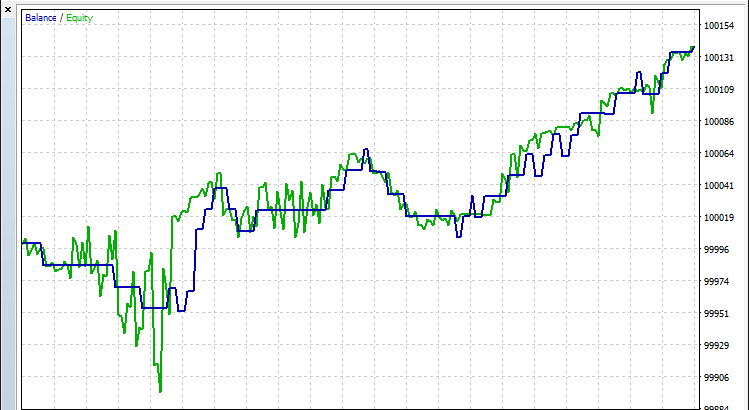
经过全面回测后,我们得到以下结果:
回测图:
回测报告:
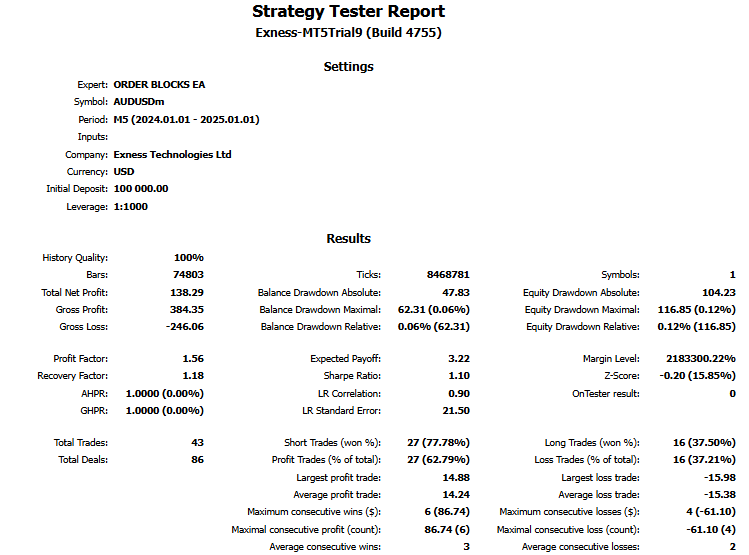
以下这段视频展示了2024年全年针对该策略的完整回测过程。
结论
综上所述,我们演示了如何开发一款基于订单块识别的MQL5 EA,该系统可应用于聪明资金(smart money)的交易策略。通过整合动态区间分析、价格行为模式及实时突破检测等工具,我们构建了一款能够精准识别关键支撑与阻力位、生成可操作交易信号并高效管理订单的程序。
免责声明:本文仅供教学参考。交易存在重大财务风险,且市场行为具有高度的不确定性。文中所述策略提供了一种结构化方法,但无法保证未来盈利。在实际交易前,请务必进行充分测试并实施严格的风险管理。
通过应用这些方法,您可构建更高效的交易系统,优化市场分析,并将算法交易提升至全新水平。祝您交易顺利!