MetaTrader 4 / インディケータ
RSI Timeframe Analyzer - MetaTrader 4のためのインディケータ
8028
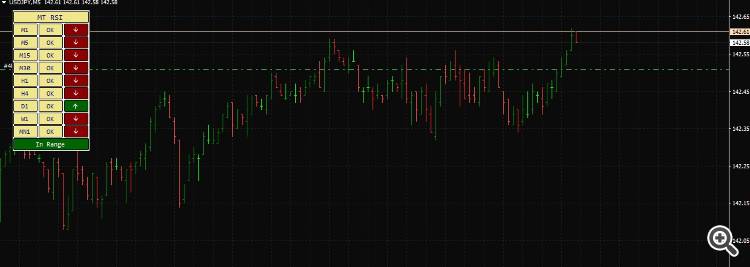
A powerful multi-timeframe RSI dashboard that visually displays the overbought, oversold, and neutral RSI status across 9 different timeframes — from M1 to MN1.
Key Features
-
RSI readings across M1 to MN1 in one view
-
Color-coded status: Overbought, Oversold, In Range
-
Works on any chart or symbol