QQE Quantitative Qualitative Estimation MT4 - MetaTrader 4のためのインディケータ
QQE MetaTrader indicator — or Quantitative Qualitative Estimation, is based on a rather complex calculation of the smoothed RSI indicators. As a result, you get two lines in a separate indicator window — the fast one and the slow one. There is also an important indicator level (50), which is used in signals. You can enable text, sound, and e-mail alerts for this indicator. This QQE implementation supports multi-timeframe analysis with upper timeframe display. The indicator is available for MT4, MT5
The presented version of the QQE indicator is free and open-source. You can easily download and install it on your trading platform.
Input parameters
- SF (default = 5) — a smoothing factor.
- AlertOnCrossover (default = false) — if true, alerts will be issued when two QQE lines cross.
- AlertOnLevel (default = false) — if true, alerts will be issued when the QQE RSI line crosses the given level.
- AlertLevel (default = 50) — indicator level for alerts. It is not recommended to change it.
- ArrowsOnCrossover (default = true) — if true, the indicator will draw arrows on the chart when the QQE lines cross each other.
- CrossoverUpArrow (default = clrGreen) — the arrow color for a bullish crossover.
- CrossoverDnArrow (default = clrRed) — the arrow color for a bearish crossover.
- ArrowsOnLevel (default = true) — if true, the indicator will draw arrows on the chart when the QQE RSI line crosses the given level.
- LevelUpArrow (default = clrGreen) — the arrow color for a line cross up.
- LevelDnArrow (default = clrRed) — the arrow color for a line cross down.
- NativeAlerts (default = false) — if true, message alerts will appear.
- EmailAlerts (default = false) — if true, email alerts will be sent according to the MetaTrader email settings.
- NotificationAlerts (default = false) — if true, push-notification alerts will be sent according to the MetaTrader notifications settings.
- UpperTimeframe (default = PERIOD_CURRENT) — if set to a timeframe above the current one, it will make the indicator calculate on that timeframe's data.
- ObjectPrefix (default = "QQE-") — the prefix for chart objects for compatibility with other indicators.
Strategy and example
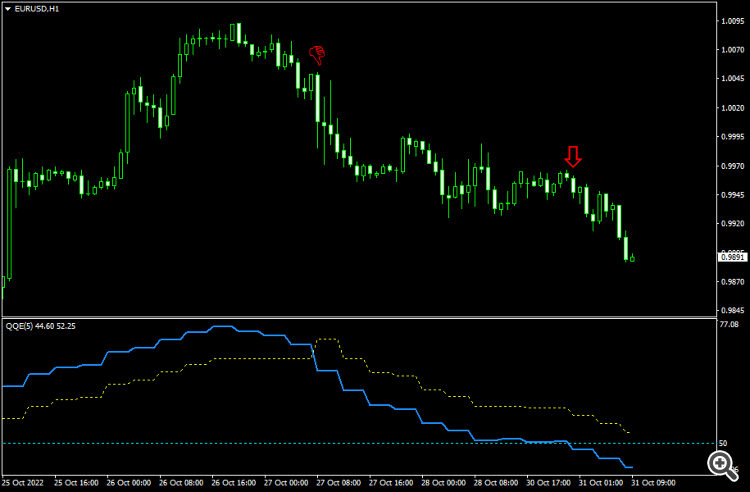
The QQE indicator is an oscillator that can be used either for direct signaling or divergence analysis. It has two types signals: two lines crossing each other and the blue line crossing a level. When the blue line crosses the yellow line from above, it is a sell signal. When the blue line crosses the yellow line from below, it is a buy signal. When the blue line crosses a given level from above, it is a sell signal. When the blue line crosses the given level from below, it is a buy signal.
The example below is showing a EUR/USD hourly chart with a QQE instance using 4-hour chart data to plot the lines. Two red arrows show two bearish signals — the first one generated the lines' crossover and the second one generated by the blue line crossing level 50.