MetaTrader 5 / Indicators
RSI_Overlay - indicator for MetaTrader 5
14543
Indicator RSI Overlay displays the chart as colored candles in accordance with the data of oscillator RSI.
It has five adjustable parameters:
- Data RSI Compare mode - RSI data comparison mode
- RSI vs level 50 - RSI line as referred to level 50
- RSI vs OB/OS levels - RSI line as referred to the overbought/oversold levels
- Current and previous RSI values - comparing the current and previous values of the RSI line
- RSI period - RSI calculation period
- RSI applied price
- RSI overbought - RSI overbought level
- RSI oversold - RSI oversold level
RSI vs level 50:
- If the RSI line is above level 50,
then the bullish candle is displayed in green
the bearish candle is displayed in light-green
- If the RSI line is below level 50,
then the bearish candle is displayed in red
the bullish candle is displayed in light-red
RSI vs OB/OS levels:
- If the RSI line is above the overbought level,
then the bullish candle is displayed in green
the bearish candle is displayed in light-green
- If the RSI line is below the oversold level,
then the bearish candle is displayed in red
the bullish candle is displayed in light-red
- In all other cases, the candle is gray
Current and previous RSI values:
- If the RSI values grow,
then the bullish candle is displayed in green
the bearish candle is displayed in light-green
- If the RSI values fall,
then the bearish candle is displayed in red
the bullish candle is displayed in light-red
- In all other cases, the candle is gray
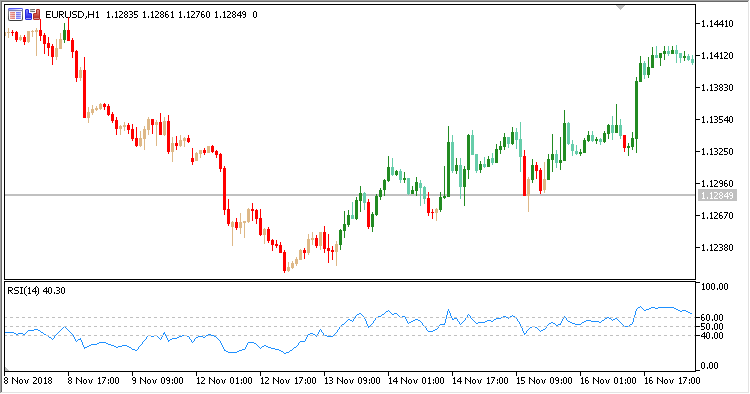
Fig. 1. RSI Overlay + RSI. Data RSI Compare mode = RSI vs level 50
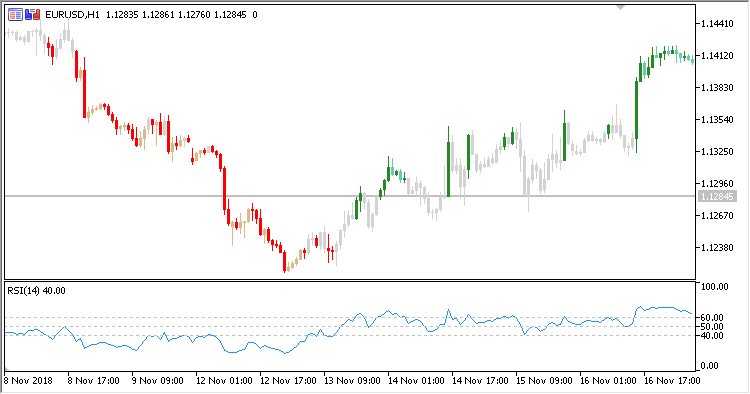
Fig. 2. RSI Overlay + RSI. Data RSI Compare mode = RSI vs OB/OS levels
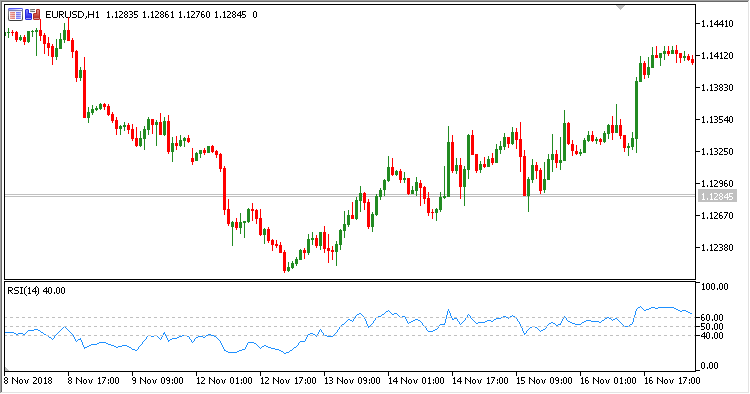
Fig. 3. RSI Overlay + RSI. Data RSI Compare mode = Current and previous RSI values
Translated from Russian by MetaQuotes Ltd.
Original code: https://www.mql5.com/ru/code/23429