Atlas Charts can visualize fields from rich data structures. You can directly access fields in embedded objects and flexibly process array fields according to your use case.
Embedded Objects
Embedded objects in the Fields section of the Chart Builder are indicated by curly brackets ({}) next to their name. To expand an object field, click the arrow to the left of the field name. You can drag embedded object fields onto the desired encoding channels just like any other field to visualize those fields in your chart.
Example
The video.movieDetails data source in the following example contains embedded objects named awards and imdb. We expand the objects by clicking the arrows to the left of their names, then in the bar chart we compare the mean imdb.rating in the Y-axis with awards.wins in the X-axis.
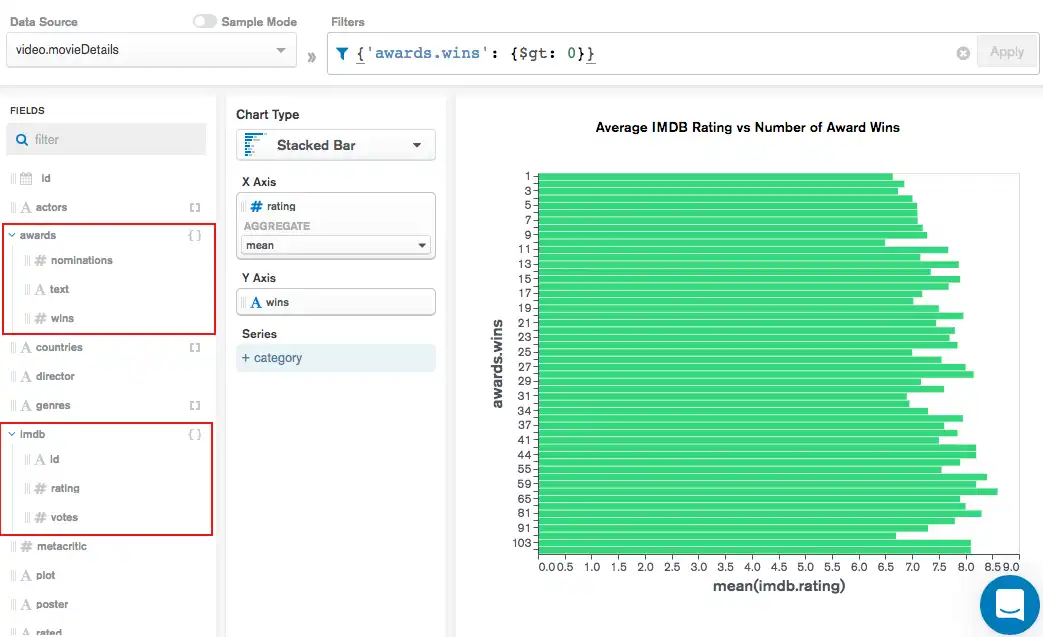
Notice the filter provided above the chart of {'awards.wins': {$gt: 0}}, meaning only movies which have won at least one award are included in the visualization. For more information on filtering documents in Atlas Charts, see the Filter Documents page.
Array Fields
Array fields in the Fields section of the Chart Builder page are indicated by square brackets ([]) next to their name. When adding an array field to an encoding channel, select an array reduction option to process the data in the best way for your visualization. The following array reduction options are available:
General Array Reduction Options
You can apply these array reduction options to any array:
Array Reduction Option | Description |
|---|---|
Unwind array | Deconstructs the array field from the input documents to output a document for each element. Each output document is a copy of the input document with the value of the array field replaced by the element. |
Array length | Counts and returns the total number of items in the array. |
Array element by index | Returns the array element at the specified zero-based index position. |
String Accumulates
You can apply these accumulates to arrays of String values:
Accumulate | Description | ||
|---|---|---|---|
concat | Concatenates the values of the array into a a single string. In the Delimiter field, enter characters that you want Charts to display between each array element. The default delimiter is For example: Consider the following array that describes movie genres: In the previous example, Charts concatenates the array to produce the following string when you enter | ||
min length | Returns the length of the shortest string in the array. | ||
max length | Returns the length of the longest string in the array. | ||
longest | Returns the longest string in the array. | ||
shortest | Returns the shortest string in the array. | ||
existence of value | Returns | ||
count of occurrences | Returns the number of times the specified string occurs in the array. |
Numeric Accumulates
You can apply these accumulates to arrays of Numeric values:
Accumulate | Description |
|---|---|
min | Returns the minimum value in the array. |
max | Returns the maximum value in the array. |
mean | Returns the mean of all values in the array. |
sum | Returns the sum of all values in the array. |
Note
Atlas Charts only displays accumulate options which match the data type of the field used in the visualization (i.e., only showing string accumulate options for string data and numeric accumulate options for numeric data).
Fields within an Array
As with array-valued fields, encoding channels require an array reduction option to be specified when handling fields within an array. In this case, the selected reduction is applied to the array containing the target field. Additionally, in the case of embedded arrays, you must select a reduction option for the top-level array and all sub-arrays. Note that different reduction options may be used for each embedded array.