OpenCV Python Program to analyze an image using Histogram
Last Updated : 11 Aug, 2025
In this article, we will learn how to analyze an image using histograms with OpenCV and Matplotlib in Python. A histogram represents the distribution of pixel intensity values in an image, helping us understand brightness, contrast and overall image composition.
Before getting started, make sure you have the following installed:
Importing image data
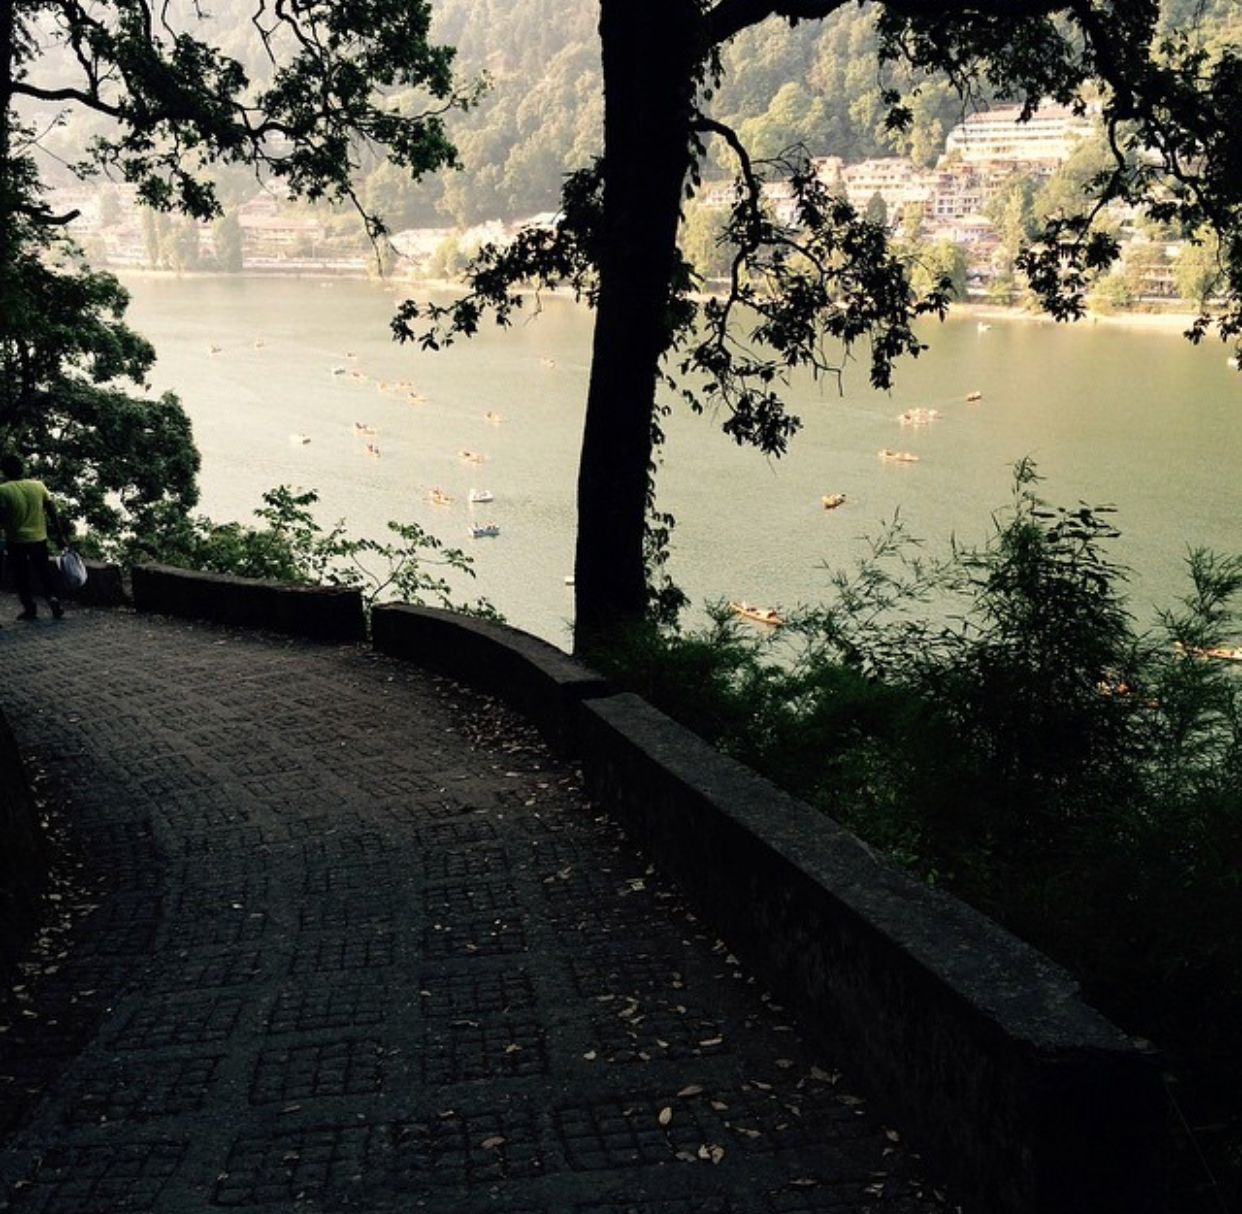
For demonstration, we will use a 24-bit RGB PNG image (8 bits for each of R, G, B channels). Matplotlib supports image arrays in float32 and uint8 formats.
Python import matplotlib.pyplot as plt import cv2 img = plt.imread('flower.png') plt.imshow(img) plt.title("Original Image") plt.show() Output
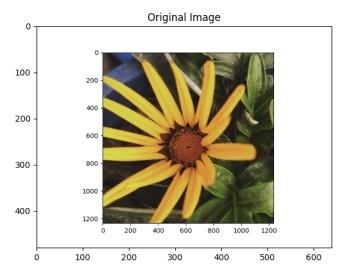 Original image
Explanation: plt.imread() loads the image as an array, plt.imshow() displays it, plt.title() adds a title, and plt.show() renders the output.
Creating Histogram using Numpy & Matplotlib
To analyze intensity distribution, we can flatten (ravel()) the image into a 1D array and use plt.hist() to compute the histogram.
- For grayscale images, this shows the spread of pixel values (0–255).
- For RGB images, we can plot separate histograms for the Red, Green and Blue channels.
Python import cv2, matplotlib.pyplot as plt img = cv2.imread("flower.png") # Grayscale + Histogram g = cv2.cvtColor(img, cv2.COLOR_BGR2GRAY) plt.subplot(121), plt.imshow(g, cmap='gray'), plt.axis("off"), plt.title("Grayscale") plt.subplot(122), plt.hist(g.ravel(),256,[0,256],color='k'), plt.title("Gray Histogram") plt.show() # RGB Histograms for i,c in enumerate(('r','g','b')): plt.plot(cv2.calcHist([img],[i],None,[256],[0,256]), color=c) plt.title("RGB Histograms"), plt.xlabel("Intensity"), plt.ylabel("Frequency") plt.show() Output
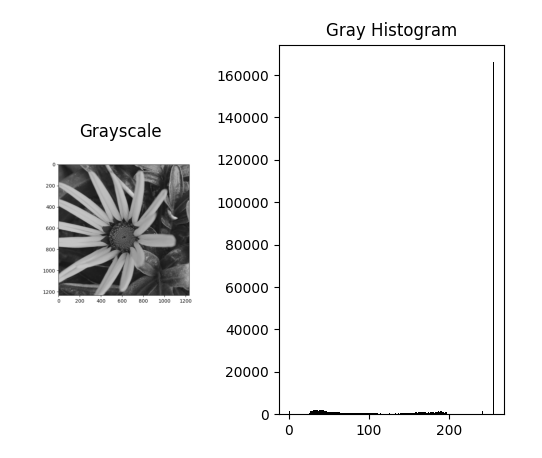 Grayscale Image
Explanation:
- cv2.imread() loads the image, cv2.cvtColor() makes it grayscale, plt.imshow() displays it, and plt.hist() shows its intensity histogram.
- A loop over ('r','g','b') uses cv2.calcHist() and plt.plot() to display RGB channel histograms.
Histogram Calculation using OpenCV
OpenCV provides an in-built function cv2.calcHist() for histogram calculation. It is more efficient and widely used in image processing tasks.
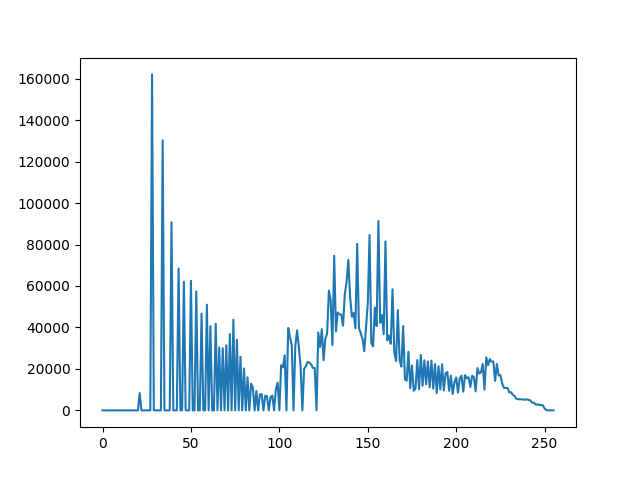
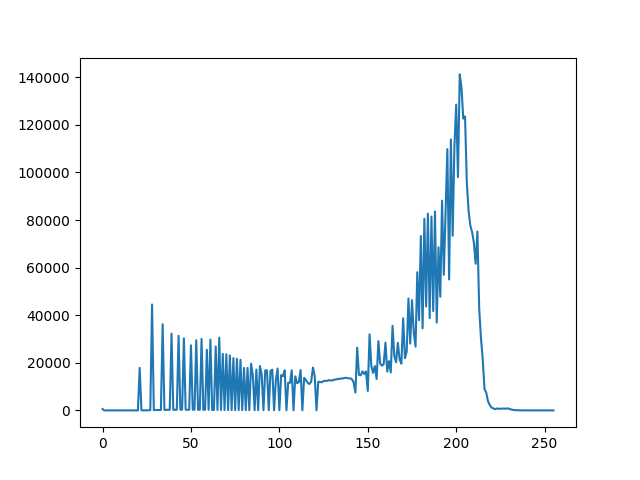
Python img = cv2.imread('flower.jpg', 0) histg = cv2.calcHist([img], [0], None, [256], [0, 256]) # Plot histogram plt.plot(histg) plt.title("Histogram using OpenCV calcHist()") plt.xlabel("Pixel Intensity") plt.ylabel("Frequency") plt.show() Output
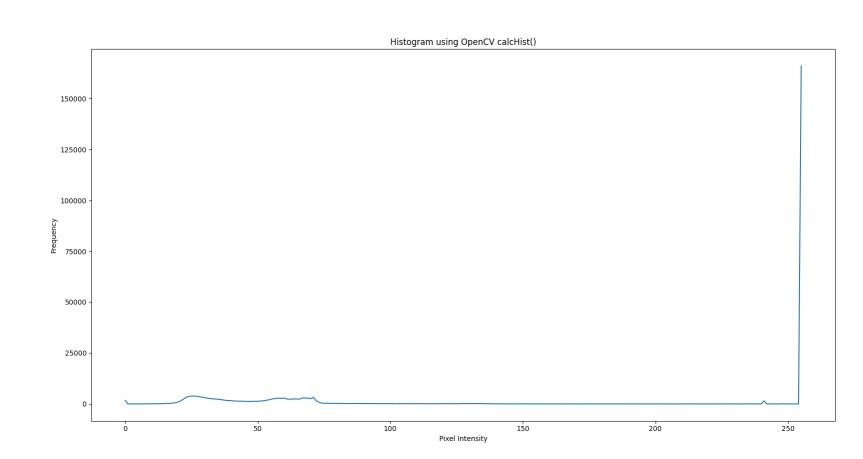 Histogram image
Explanation: cv2.imread() loads the grayscale image, cv2.calcHist() computes its histogram and plt.plot() displays it with title and labels.
Histogram for Color Images
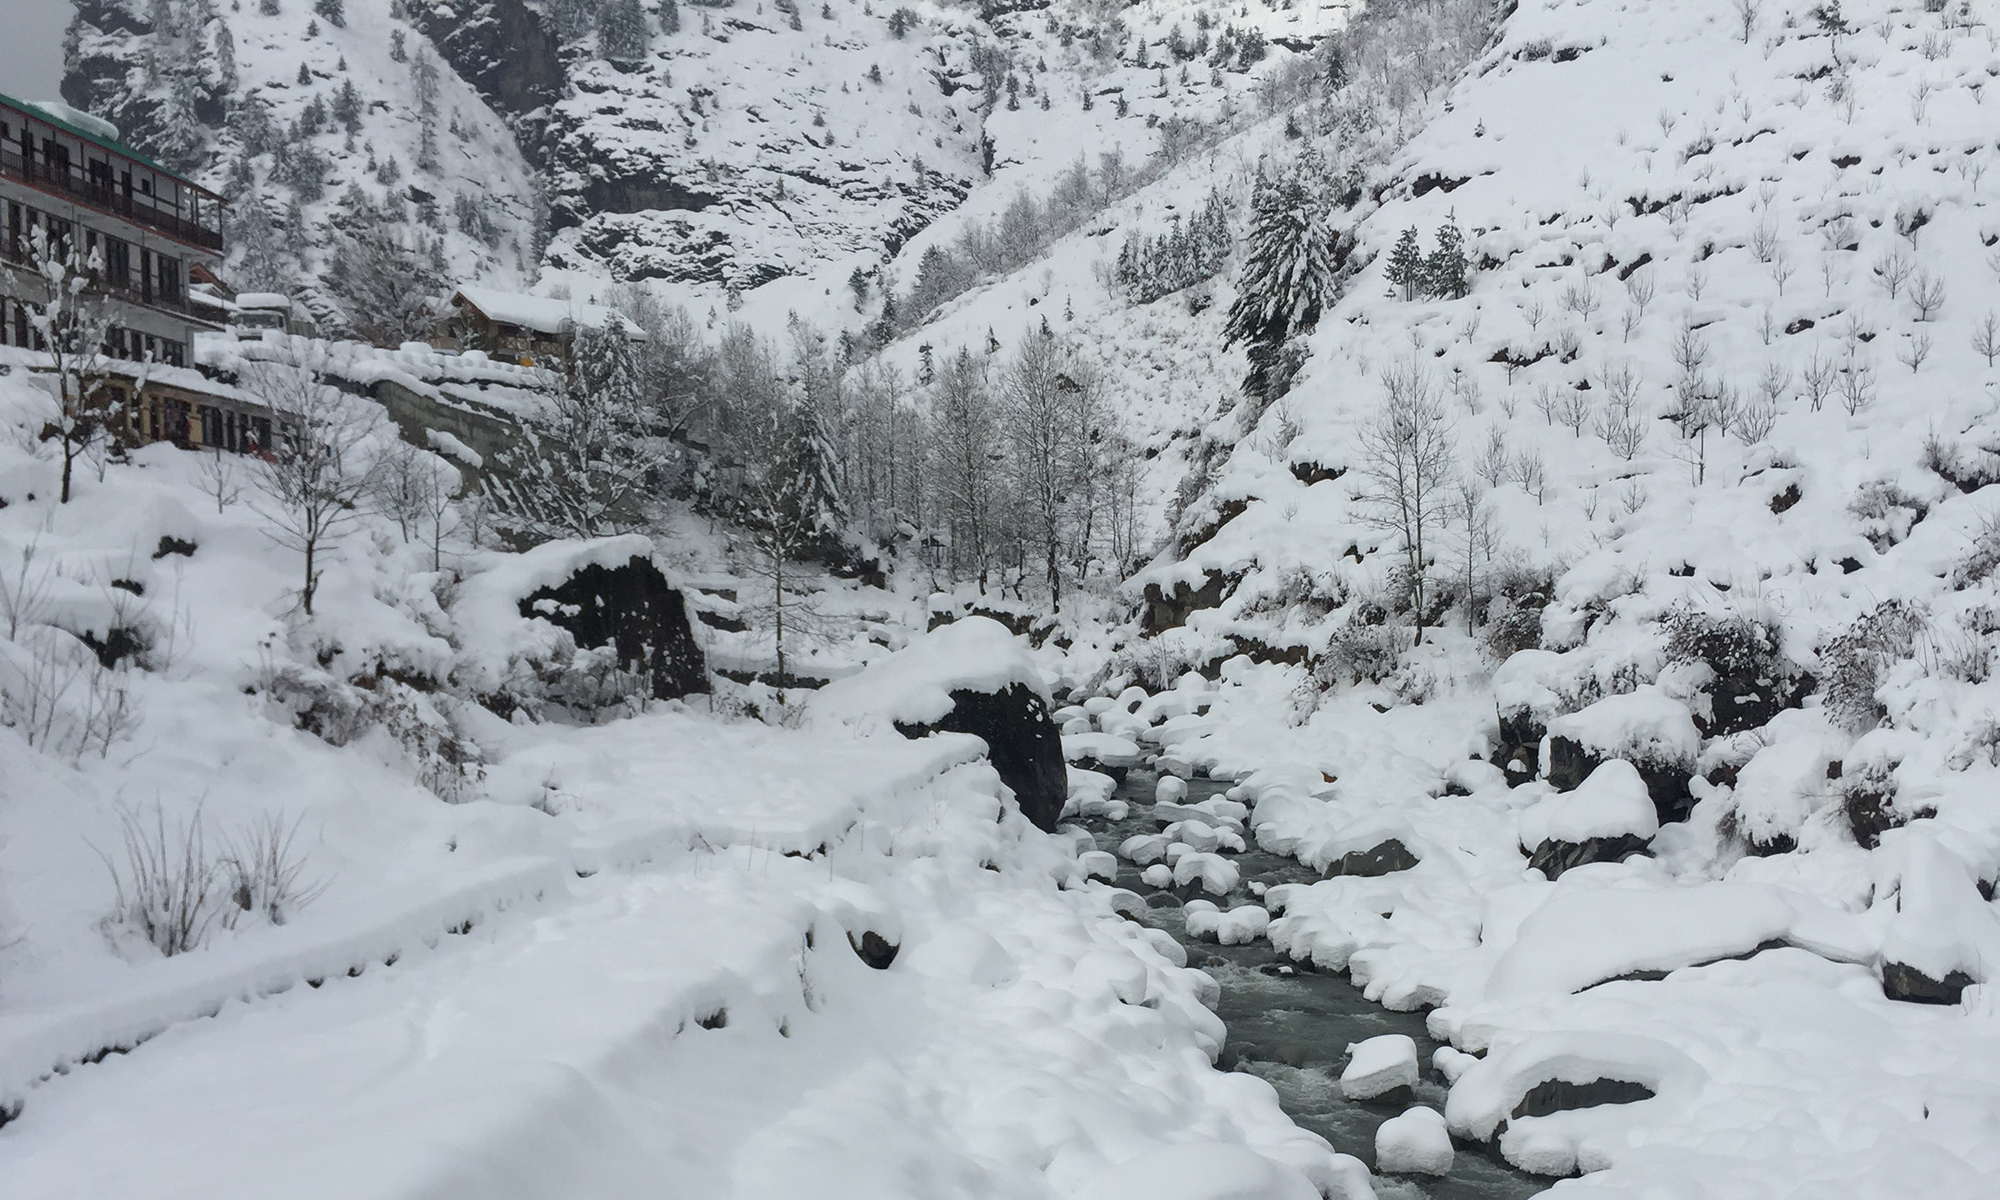
For color images, histograms can be calculated separately for Blue, Green and Red channels.
Python img = cv2.imread('ex.jpg') # colors for channels colors = ('b', 'g', 'r') for i, col in enumerate(colors): hist = cv2.calcHist([img], [i], None, [256], [0, 256]) plt.plot(hist, color=col) plt.xlim([0, 256]) plt.title("RGB Color Histogram") plt.xlabel("Pixel Intensity") plt.ylabel("Frequency") plt.show() Output
 RGB Color Histogram
Explanation: cv2.imread() loads the image, a loop over ('b','g','r') uses cv2.calcHist() to compute each channel’s histogram and plt.plot() displays them with axis labels and title.
Plotting Histograms
Apart from analyzing images with NumPy and OpenCV, we can also plot histograms using two common methods:
1. Using OpenCV (cv2.calcHist())
cv2.calcHist() calculate histograms efficiently. It gives full control over the number of bins, intensity range and even allows applying masks for region-based histogram analysis.
Python import cv2 from matplotlib import pyplot as plt img = cv2.imread('ex.jpg',0) histr = cv2.calcHist([img],[0],None,[256],[0,256]) plt.plot(histr) plt.show() Input:
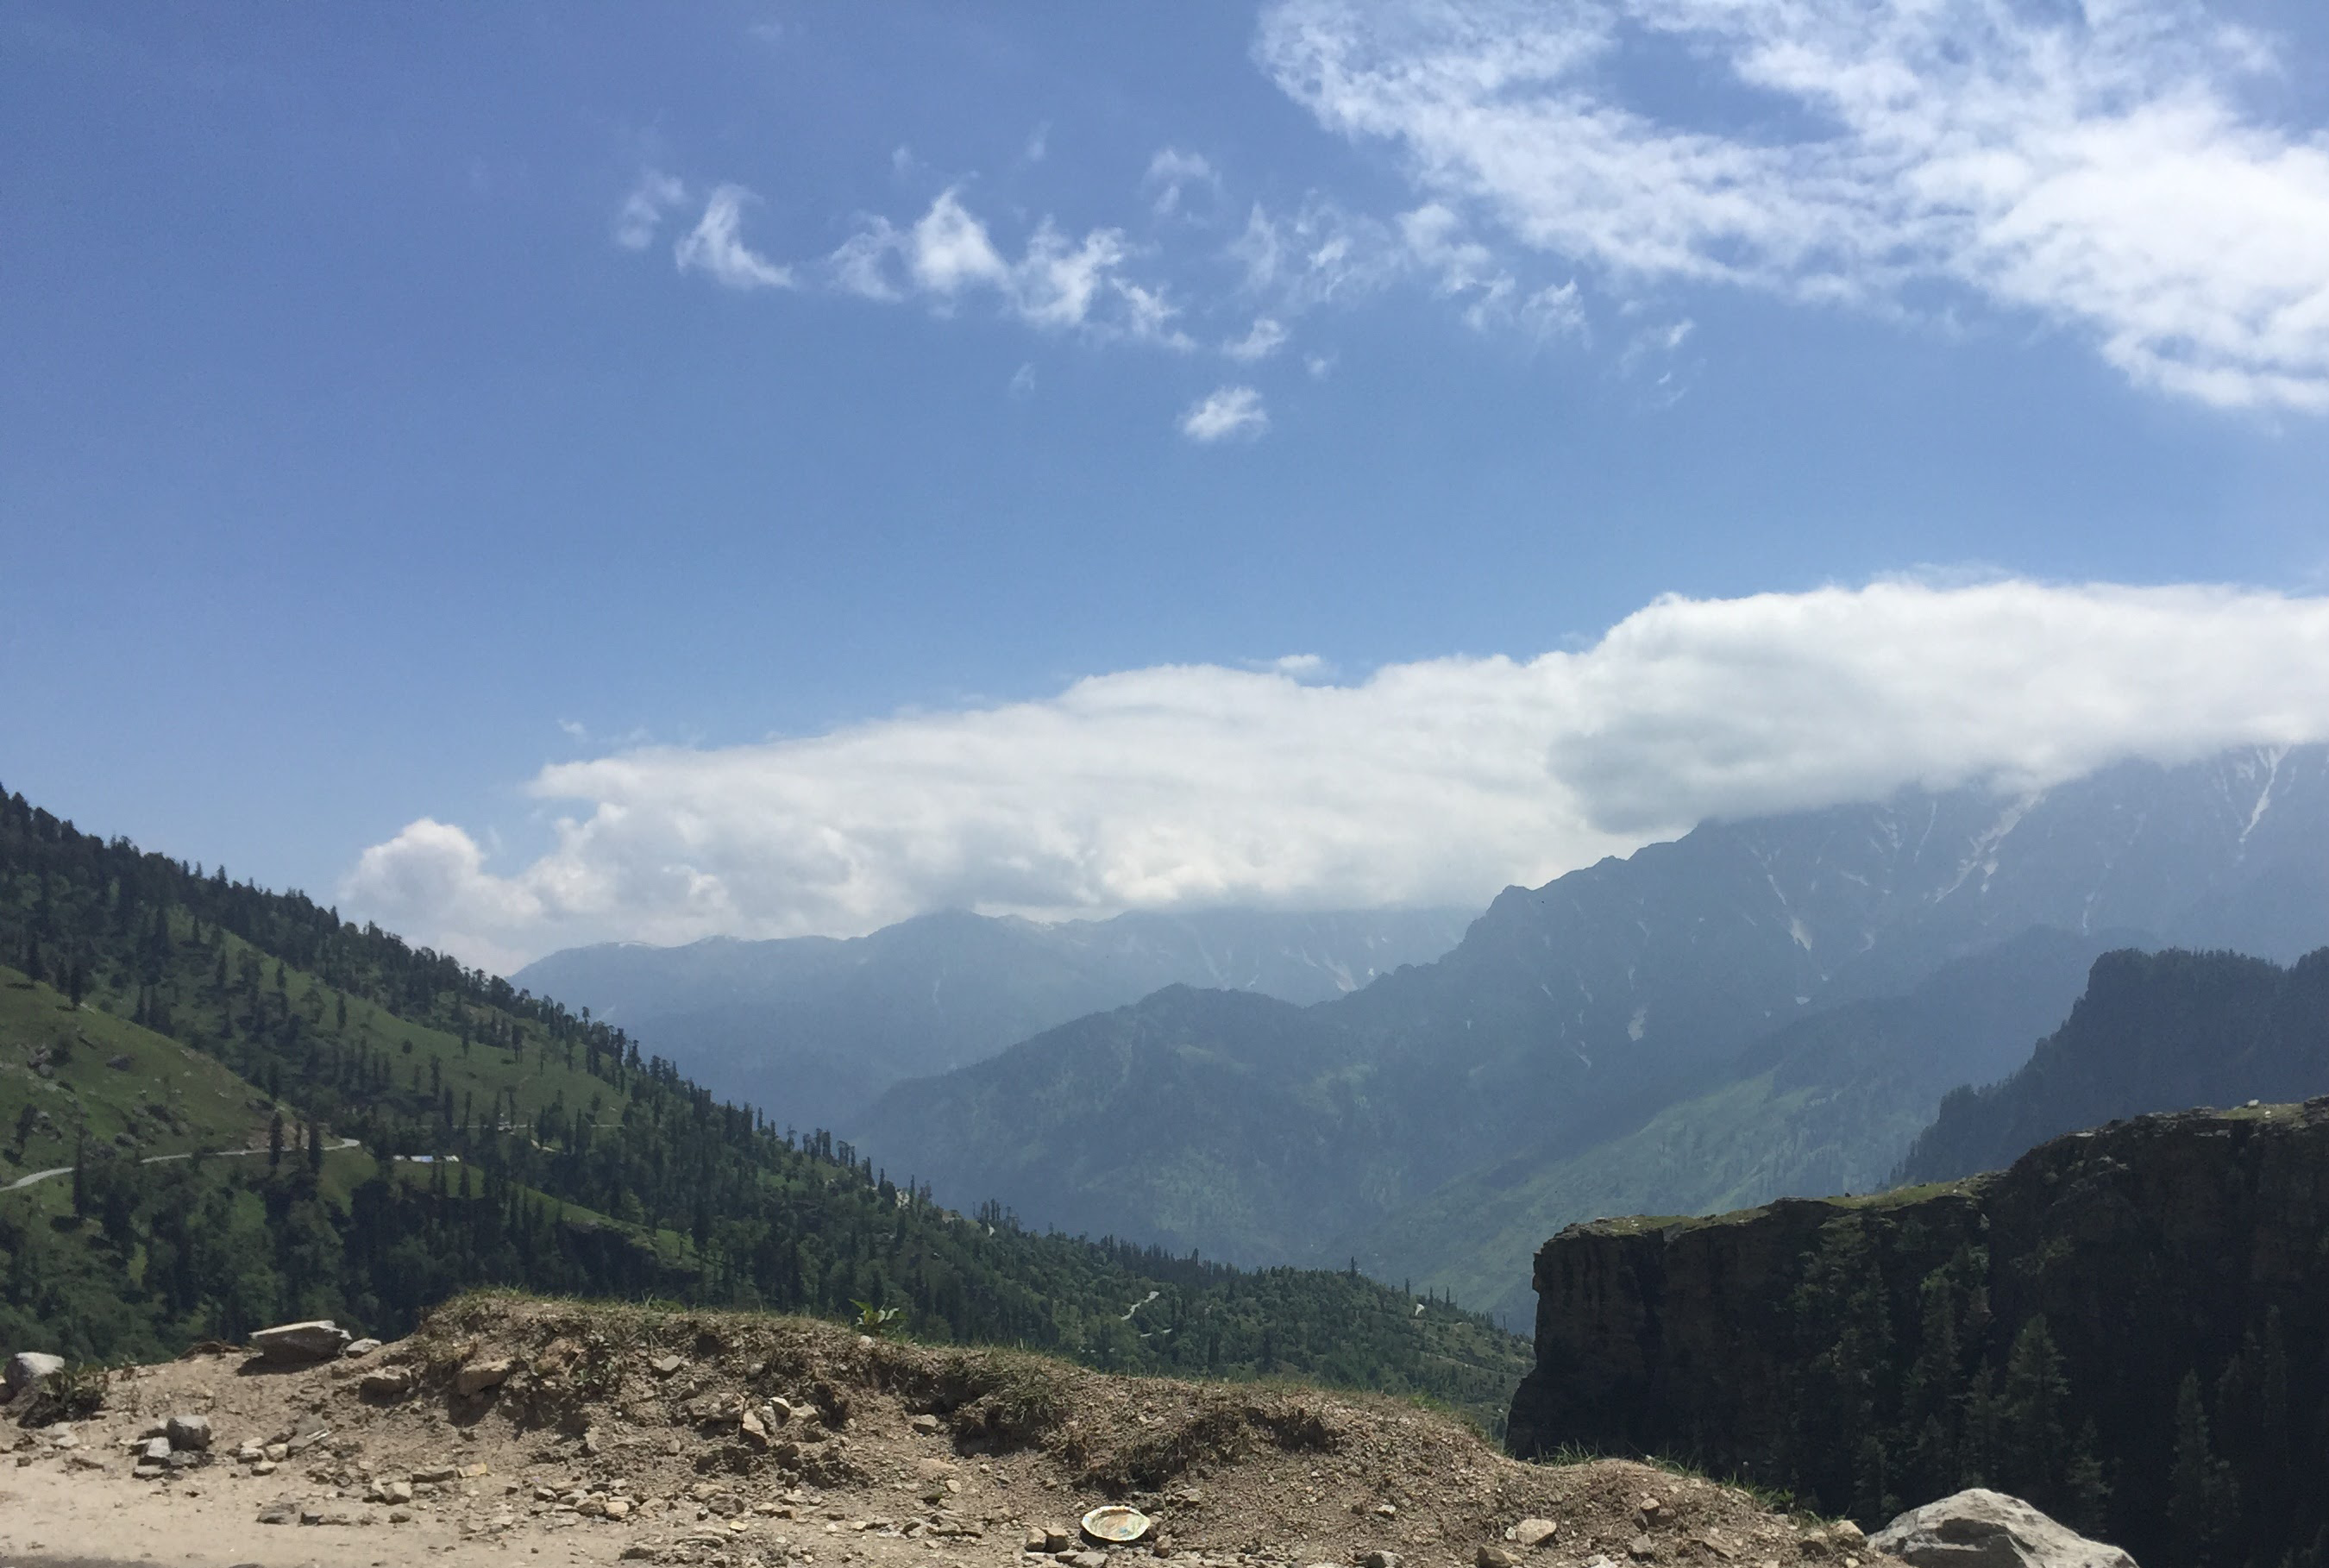
Output:
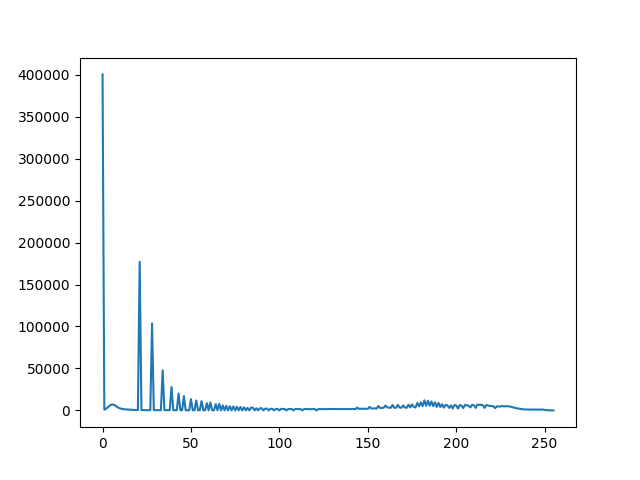
Explanation: cv2.imread() loads the image in grayscale, cv2.calcHist() computes its intensity histogram and plt.plot() displays it.
2. Using plt.hist()
plt.hist(), an image is flattened into a 1D array and its pixel intensity distribution is quickly visualized, making it ideal for simple exploration tasks.
Python import cv2 from matplotlib import pyplot as plt img = cv2.imread('ex.jpg',0) # alternative way to find histogram of an image plt.hist(img.ravel(),256,[0,256]) plt.show() Output:
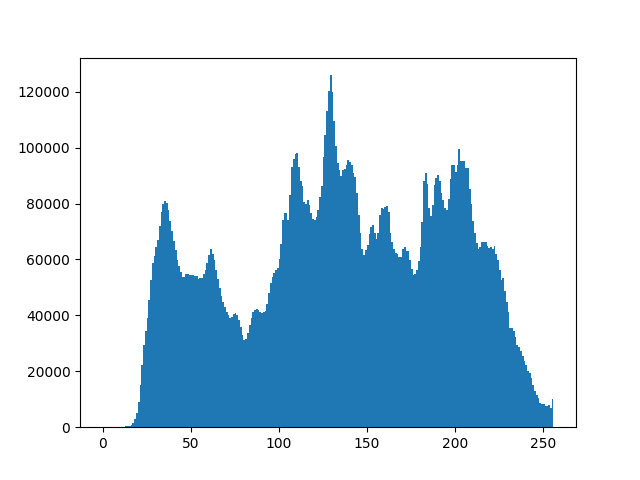
Explanation: Here, img.ravel() flattens the image into a 1D array and plt.hist() plots its pixel intensity distribution as a histogram.
Explore
Python Fundamentals
Python Data Structures
Advanced Python
Data Science with Python
Web Development with Python
Python Practice
My Profile