Matplotlib.pyplot.plot() function in Python
Last Updated : 26 Apr, 2025
The matplotlib.pyplot.plot() is used to create 2D plots such as line graphs and scatter plots. The plot() function allows us to plot data points, customize line styles, markers and colors making it useful for various types of visualizations. In this article, we'll see how to use this function to plot data in Python.
Syntax: matplotlib.pyplot.plot(*args, scalex=True, scaley=True, data=None, **kwargs)
Parameters:
- x, y: Represent horizontal and vertical coordinates for the data points.
- fmt: A format string that defines the line style, marker and colour.
- data: The optional parameter can be an object containing labelled data which makes it easier to handle datasets directly.
Returns: A list of Line2D objects each representing a segment of the plotted data.
There are many ways of creating plot using Matplotlib.pyplot.plot() function some of their examples are:
Example 1: Line Plots in Matplotlib
Here we use Matplotlib's plot() function to create a simple line plot with the data [1, 2, 3, 4, 5].
Python import matplotlib.pyplot as plt plt.plot([1, 2, 3, 4, 5]) plt.title('Basic Line Plot') plt.show() Output:
 Basic Line Plot
Example 2: Multiple Lines Using Matplotlib
We will plot sine and cosine functions on the same graph.
- plt.plot(x, y1, label='Sin(x)', color='blue'): Plots sine curve with x values and y1 values labeling it as "Sin(x)" and using a blue color for the line.
- plt.plot(x, y2, label='Cos(x)', color='red', linestyle='--'): Plots cosine curve with x values and y2 values labeling it as "Cos(x)" using a red color and a dashed line style.
Python import matplotlib.pyplot as plt import numpy as np x = np.linspace(0, 2 * np.pi, 100) y1 = np.sin(x) y2 = np.cos(x) plt.plot(x, y1, label='Sin(x)', color='blue') plt.plot(x, y2, label='Cos(x)', color='red', linestyle='--') plt.xlabel('X-axis') plt.ylabel('Y-axis') plt.title('Multiple Lines Plot') plt.legend() plt.show() Output:
 Multiple Lines Plot
Example 3: Scatter Plot with Custom Markers
We will generate and customize scatter plot with 50 random data points featuring red circular markers.
- plt.plot(x, y, marker='o', linestyle='', color='red', label='Scatter Plot'): Plots a scatter plot with x and y values and using red circular markers (marker='o') with no connecting lines (linestyle='') and labeling it as "Scatter Plot".
Python import matplotlib.pyplot as plt import numpy as np np.random.seed(42) x = np.random.rand(50) y = np.random.rand(50) plt.plot(x, y, marker='o', linestyle='', color='red', label='Scatter Plot') plt.xlabel('X-axis') plt.ylabel('Y-axis') plt.title('Scatter Plot Example') plt.legend() plt.show() Output:
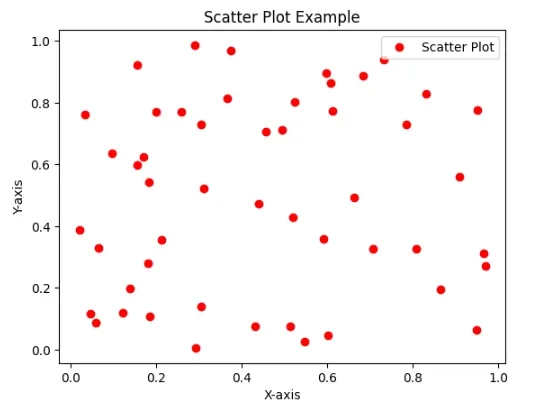 Scatter Plot with Multiple Markers
Example 4: Plotting Multiple Curves
We are creating a line plot with two curves: a blue curve y = x^2and an orange curve y = 1 - x^3 generating data randomly. The plot is limited to the range [0, 1] on both axes showcasing a visual representation of mathematical functions.
Python import matplotlib.pyplot as plt import numpy as np np.random.seed(19680801) xdata = np.random.random([2, 10]) xdata1 = xdata[0, :] xdata2 = xdata[1, :] xdata1.sort() xdata2.sort() ydata1 = xdata1 ** 2 ydata2 = 1 - xdata2 ** 3 plt.plot(xdata1, ydata1, color ='tab:blue') plt.plot(xdata2, ydata2, color ='tab:orange') plt.xlim([0, 1]) plt.ylim([0, 1]) plt.title('matplotlib.pyplot.plot() example 2') plt.show() Output:
 Two Curves Plot
With the flexibility to customize line styles, markers and colors Matplotlib's plot() function provides various possibilities for visualizing our data in Python.
Similar Reads
Python Tutorial - Learn Python Programming Language Python is one of the most popular programming languages. It’s simple to use, packed with features and supported by a wide range of libraries and frameworks. Its clean syntax makes it beginner-friendly. It'sA high-level language, used in web development, data science, automation, AI and more.Known fo
10 min read
Python Interview Questions and Answers Python is the most used language in top companies such as Intel, IBM, NASA, Pixar, Netflix, Facebook, JP Morgan Chase, Spotify and many more because of its simplicity and powerful libraries. To crack their Online Assessment and Interview Rounds as a Python developer, we need to master important Pyth
15+ min read
Non-linear Components In electrical circuits, Non-linear Components are electronic devices that need an external power source to operate actively. Non-Linear Components are those that are changed with respect to the voltage and current. Elements that do not follow ohm's law are called Non-linear Components. Non-linear Co
11 min read
Python OOPs Concepts Object Oriented Programming is a fundamental concept in Python, empowering developers to build modular, maintainable, and scalable applications. By understanding the core OOP principles (classes, objects, inheritance, encapsulation, polymorphism, and abstraction), programmers can leverage the full p
11 min read
Python Projects - Beginner to Advanced Python is one of the most popular programming languages due to its simplicity, versatility, and supportive community. Whether you’re a beginner eager to learn the basics or an experienced programmer looking to challenge your skills, there are countless Python projects to help you grow.Here’s a list
10 min read
Python Exercise with Practice Questions and Solutions Python Exercise for Beginner: Practice makes perfect in everything, and this is especially true when learning Python. If you're a beginner, regularly practicing Python exercises will build your confidence and sharpen your skills. To help you improve, try these Python exercises with solutions to test
9 min read
Python Programs Practice with Python program examples is always a good choice to scale up your logical understanding and programming skills and this article will provide you with the best sets of Python code examples.The below Python section contains a wide collection of Python programming examples. These Python co
11 min read
Spring Boot Tutorial Spring Boot is a Java framework that makes it easier to create and run Java applications. It simplifies the configuration and setup process, allowing developers to focus more on writing code for their applications. This Spring Boot Tutorial is a comprehensive guide that covers both basic and advance
10 min read
Python Introduction Python was created by Guido van Rossum in 1991 and further developed by the Python Software Foundation. It was designed with focus on code readability and its syntax allows us to express concepts in fewer lines of code.Key Features of PythonPython’s simple and readable syntax makes it beginner-frien
3 min read
Python Data Types Python Data types are the classification or categorization of data items. It represents the kind of value that tells what operations can be performed on a particular data. Since everything is an object in Python programming, Python data types are classes and variables are instances (objects) of thes
9 min read