Exporting Plots to PDF - Matplotlib
Last Updated : 17 Mar, 2025
When working with visualizations in Matplotlib, we often need to save plots in PDF format for reports, presentations, or printing. Matplotlib provides a simple way to export high-quality plots using the savefig() function, ensuring clear and professional-looking outputs. Let’s explore the best methods to export plots to PDF.
Using savefig() to Export a Single Plot
The easiest way to export a Matplotlib plot as a PDF is by using the savefig() function. This method allows us to save our figure with high quality in just one line.
Python import matplotlib.pyplot as plt # Create a simple plot plt.plot([1, 2, 3, 4], [10, 20, 25, 30], marker='o', linestyle='--', color='b') plt.title("Sample Plot") # Save the plot as a PDF plt.savefig("plot.pdf", format="pdf") # Show the plot plt.show() Output:
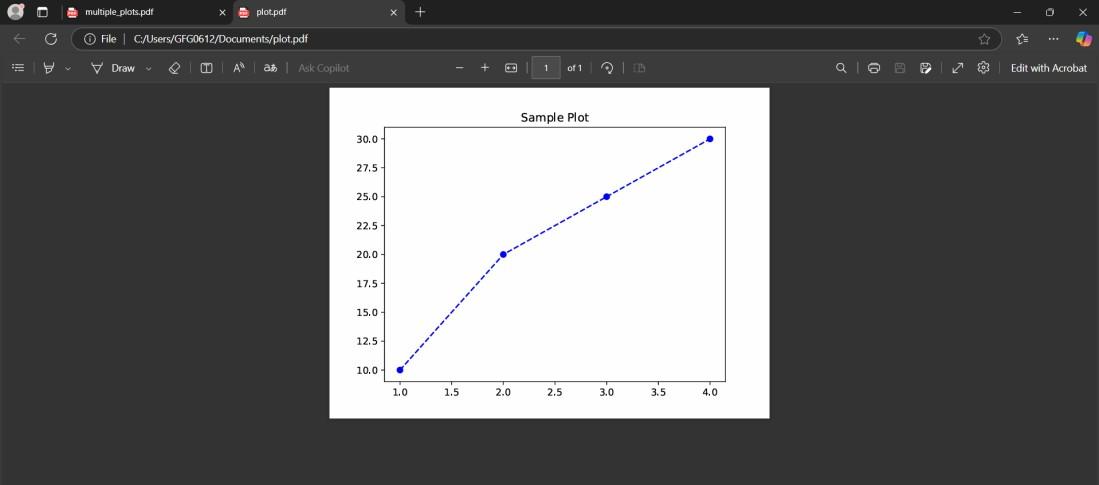 plot saved in pdf
Explanation:
- plt.plot(...) creates a simple line plot with markers.
- plt.title(...) adds a title to the plot.
- plt.savefig("plot.pdf", format="pdf") saves the figure as a PDF file.
- plt.show() displays the plot.
By default, the file is saved in the directory where the script is running. If you want to save it in a specific location, provide the full path:
plt.savefig("C:/Users/YourName/Documents/plot.pdf", format="pdf")Exporting Multiple Plots to a Single PDF
If we need to save multiple plots in a single PDF file, Matplotlib provides PdfPages, which allows us to store multiple figures in one document.
Python import matplotlib.pyplot as plt from matplotlib.backends.backend_pdf import PdfPages # Create a PDF file to store multiple plots with PdfPages("multiple_plots.pdf") as pdf: # First plot plt.figure() plt.plot([1, 2, 3], [4, 5, 6], marker='o', linestyle='--', color='r') plt.title("Plot 1") pdf.savefig() # Save the first plot plt.close() # Close the figure # Second plot plt.figure() plt.bar(["A", "B", "C"], [10, 20, 30], color="g") plt.title("Plot 2") pdf.savefig() # Save the second plot plt.close() # Close the figure Explanation:
- PdfPages("multiple_plots.pdf") creates a PDF file to store multiple plots.
- plt.figure() initializes a new figure for each plot.
- pdf.savefig() saves the current figure into the PDF.
- plt.close() closes the figure to free memory.
By default, the file is saved in the directory where the script is running. To save it elsewhere, provide the full path:
with PdfPages("C:/Users/YourName/Documents/multiple_plots.pdf") as pdf: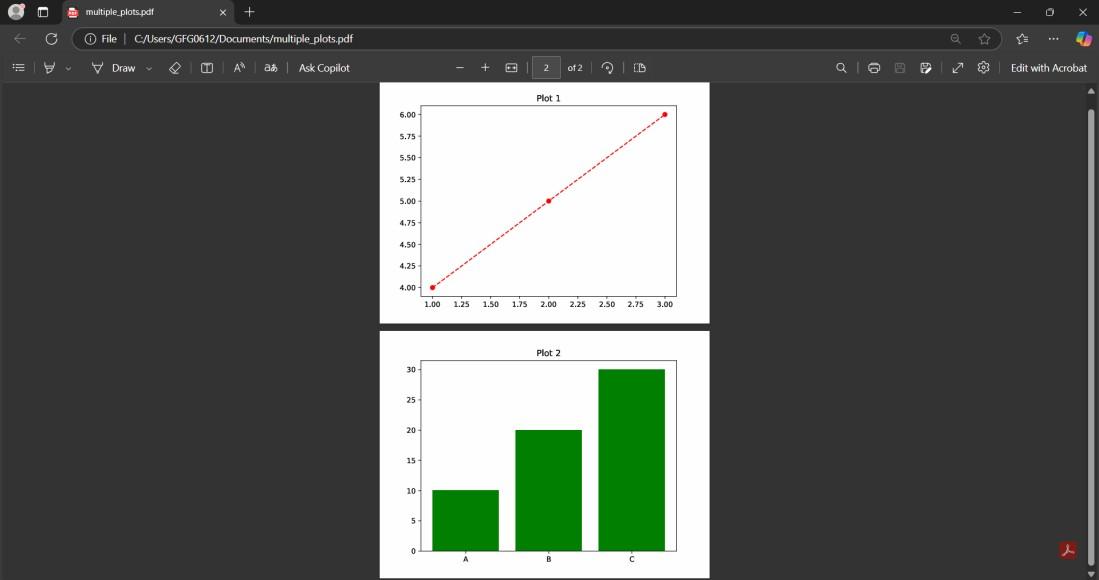 both plots saved in same pdf
 Similar Reads
Matplotlib.pyplot.axis() in Python axis() function in Matplotlib is used to get or set properties of the x- and y-axis in a plot. It provides control over axis limits, aspect ratio and visibility, allowing customization of the plot’s coordinate system and view. It's key feature includes:Gets or sets the axis limits [xmin, xmax, ymin,
3 min read
Matplotlib.pyplot.axes() in Python axes() method in Matplotlib is used to create a new Axes instance (i.e., a plot area) within a figure. This allows you to specify the location and size of the plot within the figure, providing more control over subplot layout compared to plt.subplot(). It's key features include:Creates a new Axes at
3 min read
Matplotlib.pyplot.axvspan() in Python Matplotlib is a plotting library for creating static, animated, and interactive visualizations in Python.\ Pyplot is a Matplotlib module which provides a MATLAB-like interface. Matplotlib is designed to be as usable as MATLAB, with the ability to use Python and the advantage of being free and open-s
2 min read
Matplotlib Pyplot API Data visualization plays a key role in data science and analysis. It enables us to grasp datasets by representing them. Matplotlib, a known Python library offers a range of tools, for generating informative and visually appealing plots and charts. One outstanding feature of Matplotlib is its user-ve
4 min read
matplotlib.pyplot.figure() in Python Matplotlib is a library in Python and it is numerical - mathematical extension for NumPy library. Pyplot is a state-based interface to a Matplotlib module which provides a MATLAB-like interface. There are various plots which can be used in Pyplot are Line Plot, Contour, Histogram, Scatter, 3D Plot,
2 min read
How to import matplotlib in Python? Matplotlib is a Python library used to create different types of charts and graphs. It helps to turn data into visual formats like line charts, bar graphs and histograms. This makes it easier to understand and present your data. In this guide you’ll learn how to install and import Matplotlib in Pyth
1 min read