How to Show Text on a Heatmap with Plotly
Last Updated : 23 Jul, 2025
Heatmaps are a powerful visualization tool commonly used to represent the magnitude of values across a matrix or a 2D grid. They are particularly useful in highlighting areas of high and low intensity, making patterns more discernible. Polly, a data science platform by Fuzzy Labs, provides robust tools for creating heatmaps and adding text annotations to enhance data interpretation. This article will guide you through the process of creating a heatmap with text annotations using Plotly.
Creating a Heatmap with Text Annotations
1. Introduction to Heatmaps
Heatmaps are graphical representations of data where individual values contained in a matrix are represented as colors. They are extensively used in various fields such as genomics, finance, and marketing analytics to visualize complex data sets. While heatmaps are visually intuitive, adding text annotations can significantly enhance their readability and the granularity of the information conveyed.
2. Introduction to Plotly
Plotly is an open-source graphing library that makes interactive, publication-quality graphs online. It supports a wide range of chart types, including heatmaps, and offers extensive customization options. One of Plotly's strengths is its ability to create interactive visualizations that can be embedded in web applications or shared online.
Annotating Heatmaps with Text
Annotated heatmaps display additional information by overlaying text on the heatmap cells. This can be particularly useful for highlighting specific values or providing context. Plotly offers two primary methods for creating annotated heatmaps:
- Using
plotly.express with px.imshow - Using
plotly.graph_objects with go.Heatmap
Step-by-Step Guide for Adding Text on a Heatmap
Step 1: Install Plotly
First, ensure that Plotly is installed in your Python environment. If not, you can install it using pip:
pip install plotly
Step 2: Prepare Your Data
Prepare the data that you want to visualize in a heatmap. Typically, the data should be in a matrix or 2D array format.
Python import numpy as np # Sample data data = np.random.rand(10, 10)
Step 3: Create a Basic Heatmap
Use Plotly's plotly.graph_objects module to create a basic heatmap.
Python import plotly.graph_objects as go # Create heatmap fig = go.Figure(data=go.Heatmap( z=data, colorscale='Viridis' )) # Show figure fig.show()
Output:
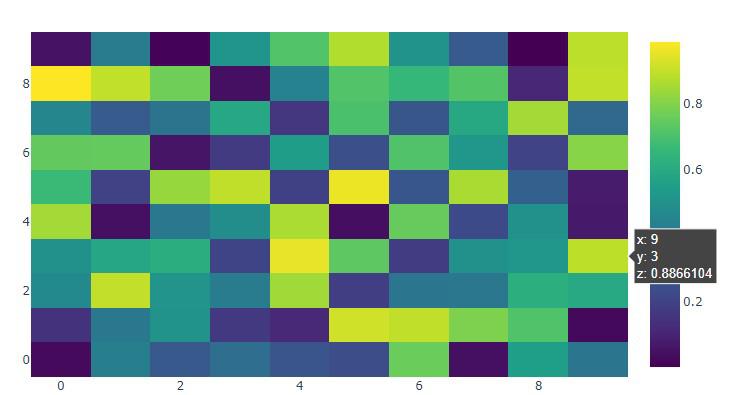 How to Show Text on a Heatmap with Polly
Step 4: Add Text Annotations
To add text annotations, you need to generate a text matrix that matches the dimensions of your data matrix. Each element in the text matrix will correspond to a cell in the heatmap. Annotated heatmaps display additional information by overlaying text on the heatmap cells. This can be particularly useful for highlighting specific values or providing context. Plotly offers two primary methods for creating annotated heatmaps:
1. Using plotly.graph_objects with go.Heatmap
Python # Generate text annotations text = np.round(data, 2).astype(str) # Create heatmap with annotations fig = go.Figure(data=go.Heatmap( z=data, text=text, texttemplate="%{text}", colorscale='Viridis' )) # Show figure fig.show() Output:
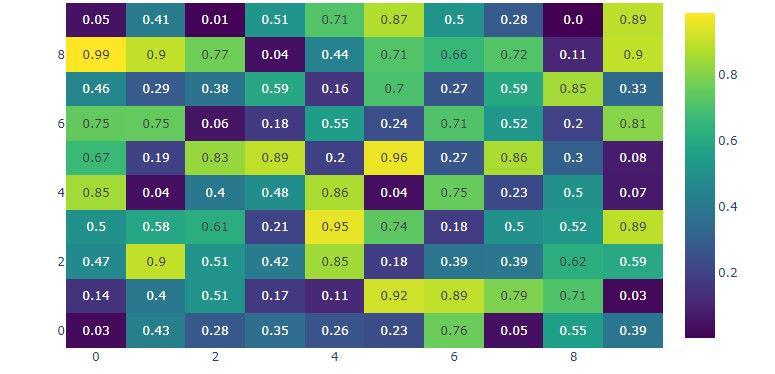 How to Show Text on a Heatmap with Polly
2. Using plotly.express with px.imshow
Python import plotly.express as px # Sample data z = [[.1, .3, .5], [1.0, .8, .6], [.6, .4, .2]] z_text = [['Low', 'Medium', 'High'], ['Very High', 'High', 'Medium'], ['Medium', 'Low', 'Very Low']] # Create annotated heatmap fig = px.imshow(z, text_auto=True, color_continuous_scale='Viridis') fig.update_traces(text=z_text, texttemplate="%{text}") fig.show() Output:
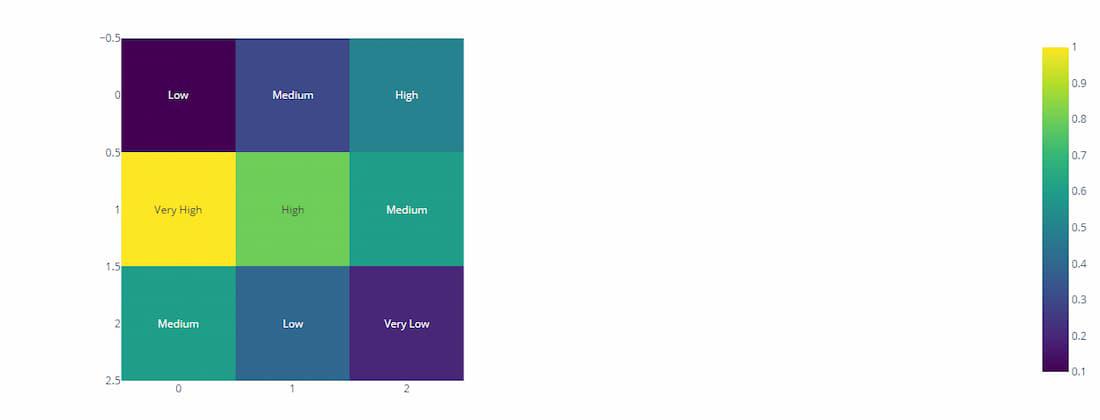 Using plotly.express with px.imshow
Step 5: Customize the Heatmap
You can customize various aspects of the heatmap, including the colorscale, text format, and layout.
Python # Customize heatmap fig = go.Figure(data=go.Heatmap( z=data, text=text, texttemplate="%{text}", colorscale='Viridis', hoverinfo='z' # Show data value on hover )) # Customize layout fig.update_layout( title='Heatmap with Annotations', xaxis_nticks=36, yaxis_nticks=36 ) # Show figure fig.show() Output:
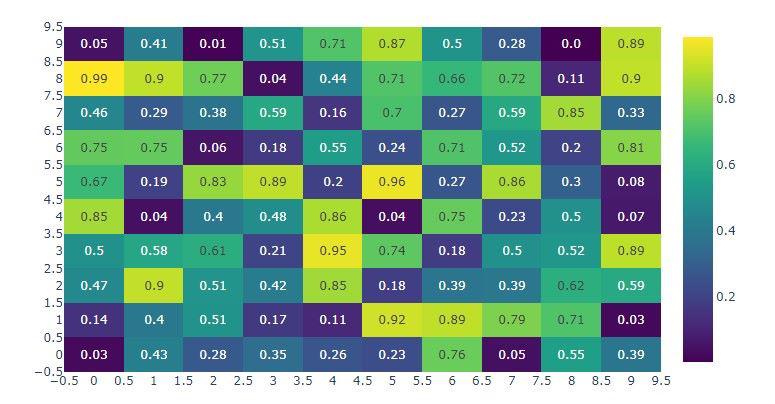 How to Show Text on a Heatmap with Polly
Conclusion
Creating heatmaps with text annotations using Plotly is straightforward and offers a high degree of customization and interactivity. By following the steps outlined in this article, you can create informative and visually appealing heatmaps that effectively convey the underlying data patterns. Plotly's interactive capabilities further enhance the usability of these visualizations, making them ideal for exploratory data analysis and presentation.