Matplotlib 튜토리얼-파이 차트
Jinku Hu 2024년2월15일 Matplotlib Matplotlib Pie Chart

이 튜토리얼에서 원형 차트를 배웁니다.
Matplotlib 파이 차트
# -*- coding: utf-8 -*- import matplotlib.pyplot as plt x = np.array([15, 25, 30, 40]) label = ["France", "Germany", "Uk", "US"] plt.pie(x, labels=label) plt.show() 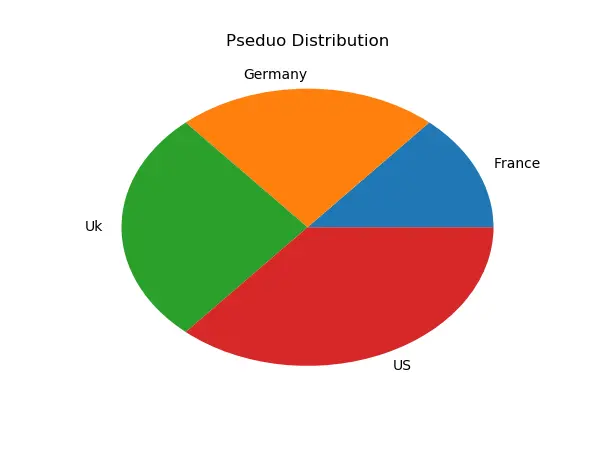
통사론
matplotlib.pyplot.pie( x, explode=None, labels=None, colors=None, autopct=None, pctdistance=0.6, shadow=False, labeldistance=1.1, startangle=None, radius=None, counterclock=True, wedgeprops=None, textprops=None, center=(0, 0), frame=False, hold=None, data=None, ) ** 매개 변수 **
| 이름 | 기술 |
|---|---|
label | 라벨 텍스트 |
fontdict | 가족, 색상, 무게 및 크기와 같은 레이블 텍스트 글꼴 사전 |
labelpad | 레이블과 x 축 사이의 포인트 간격 |
시계 방향의 Matplotlib 원형 차트
counterclock인수가 False로 설정되면 원형 차트가 시계 방향으로 그려집니다.
# -*- coding: utf-8 -*- import matplotlib.pyplot as plt x = np.array([15, 25, 30, 40]) label = ["France", "Germany", "Uk", "US"] plt.pie(x, labels=label, counterclock=False) plt.show() 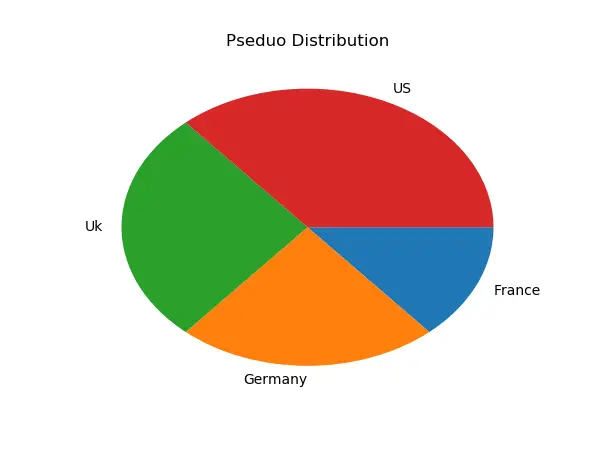
분해 슬라이스 Matplotlib 원형 차트
explode 매개 변수는 파이 차트에서 조각의 분해를 제어합니다. 각 웨지를 오프셋하는 반지름의 비율을 지정합니다.
# -*- coding: utf-8 -*- import matplotlib.pyplot as plt x = np.array([15, 25, 30, 40]) label = ["France", "Germany", "Uk", "US"] plt.pie(x, labels=label, explode=(0.2, 0, 0, 0)) plt.show() 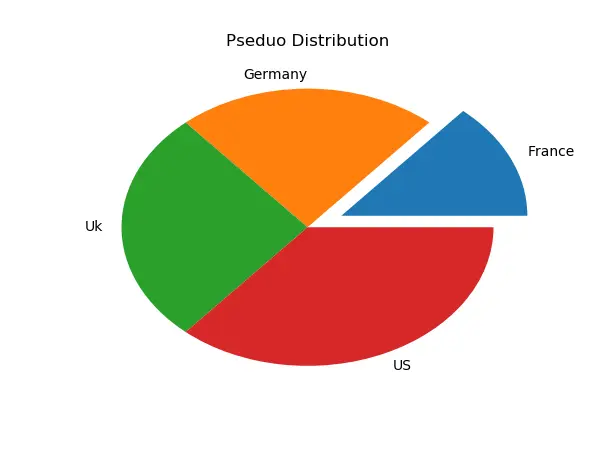
튜토리얼이 마음에 드시나요? DelftStack을 구독하세요 YouTube에서 저희가 더 많은 고품질 비디오 가이드를 제작할 수 있도록 지원해주세요. 구독하다
작가: Jinku Hu

Founder of DelftStack.com. Jinku has worked in the robotics and automotive industries for over 8 years. He sharpened his coding skills when he needed to do the automatic testing, data collection from remote servers and report creation from the endurance test. He is from an electrical/electronics engineering background but has expanded his interest to embedded electronics, embedded programming and front-/back-end programming.
LinkedIn Facebook