In a Kubernetes environment, managing scattered container logs can be difficult, which results in inefficient troubleshooting and high O&M costs. You can deploy the Simple Log Service (SLS) LoongCollector in DaemonSet mode and configure log collection in the SLS console to enable unified log collection and structured processing. This approach improves the efficiency of log retrieval, problem diagnosis, and observability analysis.
Scope
Runtime environment:
Supports Container Service for Kubernetes (ACK) (Managed and Dedicated editions) and self-managed Kubernetes clusters.
Kubernetes version 1.10.0 or later that supports
Mount propagation: HostToContainer.Container runtime (Docker and Containerd only)
Docker:
Requires access to docker.sock.
Standard output collection supports only the JSON log driver.
Supports only the overlay and overlay2 storage drivers. For other storage driver types, you must manually mount the log directory.
Containerd: Requires access to containerd.sock.
Resource requirements: LoongCollector (Logtail) runs with high priority as system-cluster-critical. Do not deploy it if cluster resources are insufficient, because this may evict existing pods on the node.
CPU: Reserve at least 0.1 Core.
Memory: Reserve at least 150 MB for the collection component and at least 100 MB for the controller component.
Actual usage depends on the collection rate, the number of monitored directories and files, and the level of send congestion. Ensure that the actual usage remains below 80% of the limit.
Permission requirements: The Alibaba Cloud account or RAM user used for deployment must have the
AliyunLogFullAccesspermission.To create custom policies, you can refer to the AliyunCSManagedLogRolePolicy system policy. Copy the permissions included in the policy and grant them to the target RAM user or role to configure fine-grained permissions.
Collection configuration workflow
Install LoongCollector: Deploy LoongCollector in DaemonSet mode. This ensures that a collection container runs on each node in the cluster to collect logs from all containers on that node.
For the Sidecar pattern, see Collect text logs from a cluster (Sidecar).
Create a Logstore: A Logstore is a storage unit for log data. You can create multiple Logstores in a project.
Create a collection configuration:
This topic describes only common configuration parameters and core options for typical use cases. For a complete list of configuration parameters and their descriptions, see the More information section.
Minimal configuration (Required): Establish a data collection tunnel from the cluster to the Simple Log Service project.
Common processing configurations (Optional): Configure common data processing plugins to parse raw logs into structured data. For example, you can use regular expressions or delimiters for parsing, or perform data masking and filtering.
This topic describes only native processing plugins that cover common log processing scenarios. For more features, see Extended processing plugins.
Other advanced configurations (Optional): Collect multiline text logs and enrich log tags for more fine-grained collection.
Install LoongCollector (Logtail)
LoongCollector is a new-generation log collection agent from SLS and an upgraded version of Logtail. LoongCollector and Logtail cannot coexist. To install Logtail, see Install, run, upgrade, and uninstall Logtail.
This topic describes only the basic steps to install LoongCollector. For more information about the parameters, see Install LoongCollector (Kubernetes). If you have installed LoongCollector or Logtail, you can skip this step and create a Logstore to store the collected logs.
ACK cluster
You can install LoongCollector from the Container Service for Kubernetes console. By default, logs are sent to a Simple Log Service project under the current Alibaba Cloud account.
Log on to the ACK console. In the left navigation pane, click Clusters.
On the Clusters page, click the name of the target cluster.
In the navigation pane on the left, click Add-ons.
On the Logs And Monitoring tab, find loongcollector and click Install.
NoteFor a new cluster, on the Component Configurations page, select Enable Log Service. Then, you can Create Project or Use Existing Project.
After the installation is complete, SLS automatically creates related resources in the region where the ACK cluster resides. You can log on to the Simple Log Service console to view them.
Resource type
Resource name
Function
Project
k8s-log-${cluster_id}A resource management unit that isolates logs of different services.
To create a Project for more flexible log resource management, see Create a Project.
Machine group
k8s-group-${cluster_id}A collection of log collection nodes.
Logstore
config-operation-logImportantDo not delete this Logstore.
Stores logs of the loongcollector-operator component. Its billing method is the same as that of a regular Logstore. For more information, see Billable items of the pay-by-ingested-data mode. We recommend that you do not create collection configurations in this Logstore.
Self-managed cluster
Connect to the Kubernetes cluster. Select the command for your region to download LoongCollector and its dependent components:
Regions in China:
wget https://aliyun-observability-release-cn-shanghai.oss-cn-shanghai.aliyuncs.com/loongcollector/k8s-custom-pkg/3.0.12/loongcollector-custom-k8s-package.tgz; tar xvf loongcollector-custom-k8s-package.tgz; chmod 744 ./loongcollector-custom-k8s-package/k8s-custom-install.shRegions outside China:
wget https://aliyun-observability-release-ap-southeast-1.oss-ap-southeast-1.aliyuncs.com/loongcollector/k8s-custom-pkg/3.0.12/loongcollector-custom-k8s-package.tgz; tar xvf loongcollector-custom-k8s-package.tgz; chmod 744 ./loongcollector-custom-k8s-package/k8s-custom-install.shGo to the
loongcollector-custom-k8s-packagedirectory and modify the./loongcollector/values.yamlconfiguration file.# ===================== Required Information ===================== # The name of the project where logs from this cluster will be collected, for example, k8s-log-custom-sd89ehdq projectName: "" # The region of the project, for example, Shanghai: cn-shanghai region: "" # The UID of the Alibaba Cloud account that owns the project. Enclose it in quotation marks, for example, "123456789" aliUid: "" # The network to use. Optional parameters: Internet, Intranet. The default is Internet. net: Internet # The AccessKey ID and AccessKey secret of the Alibaba Cloud account or RAM user. The account must have the AliyunLogFullAccess system policy permission. accessKeyID: "" accessKeySecret: "" # A custom cluster ID. The name can contain only uppercase letters, lowercase letters, digits, and hyphens (-). clusterID: ""In the
loongcollector-custom-k8s-packagedirectory, run the following command to install LoongCollector and other dependent components:bash k8s-custom-install.sh installAfter the installation is complete, check the running status of the components.
If a pod fails to start, check whether the values.yaml configuration is correct and whether the relevant images were pulled successfully.
# Check the pod status kubectl get po -n kube-system | grep loongcollector-dsSLS also automatically creates the following resources. You can log on to the Simple Log Service console to view them.
Resource type
Resource name
Function
Project
The value of
projectNamedefined in the values.yaml fileA resource management unit that isolates logs of different services.
To create a Project for more flexible log resource management, see Create a Project.
Machine group
k8s-group-${cluster_id}A collection of log collection nodes.
Logstore
config-operation-logImportantDo not delete this Logstore.
Stores logs of the loongcollector-operator component. Its billing method is the same as that of a regular Logstore. For more information, see Pay-by-data-written billable items. We recommend that you do not create collection configurations in this Logstore.
Create a Logstore
If you have already created a Logstore, you can skip this step and proceed to create a collection configuration.
SLS supports two billing methods: pay-by-ingested-data and pay-by-feature. When you create a Logstore, you can choose the appropriate billing method based on your specific scenario.
Log on to the Simple Log Service console and click the name of the target project.
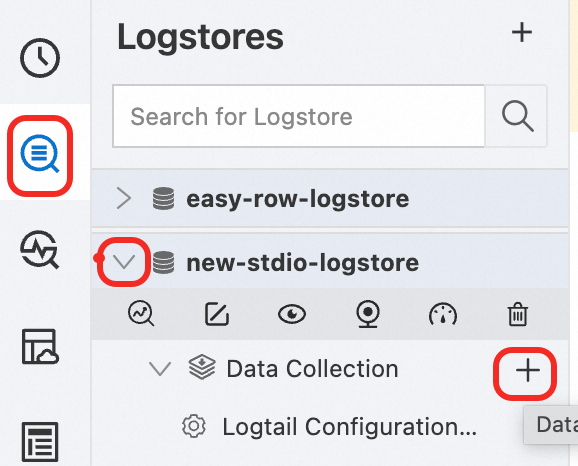
In the navigation pane on the left, choose
 , and click +.
On the Create Logstore page, complete the following core configurations:
Logstore Name: Set a name that is unique within the project. This name cannot be changed after creation.
Logstore Type: Choose Standard or Query based on a comparison of their specifications.
Billing Mode:
Pay-By-Feature: Billed independently for resources such as storage, indexing, and read/write operations. This method is suitable for small-scale use cases or when feature usage is uncertain.
Pay-By-Ingested-Data: Billed only by the amount of raw data written. It provides a 30-day free storage period and free features such as data transformation and delivery. The cost model is simple and suitable for use cases where the storage period is close to 30 days or the data processing pipeline is complex.
Data Retention Period: Set the number of days to retain logs. The value ranges from 1 to 3,650 days. A value of 3,650 days means permanent storage. The default is 30 days.
Keep the default settings for other configurations and click OK. For more information about other configurations, see Manage a Logstore.
Minimal configuration
After you install LoongCollector and create a Logstore, you can create a collection configuration. This section describes two basic scenarios: container standard output and cluster text logs. These scenarios upload raw logs to the Logstore without parsing or processing, which makes them suitable for quickly establishing a data channel.
On the Logstore
|
|
Collect container standard output (stdout)
| Raw log: |
Collected raw standard output (stdout): |
Collect cluster text logs
| Raw log: |
The entire raw log line is stored in the content field: |
Common processing configurations
After you complete the minimal configuration, in the Processing Configuration section of the Logtail Configuration page, you can add processing plugins to parse raw logs into structured data, or perform data masking and filtering. To add processing plugins to an existing collection configuration, you can follow these steps:
In the navigation pane on the left, choose
 Logstores and find the target Logstore.
Click
 before its name to expand the Logstore.
Click Logtail Configurations. In the configuration list, find the target Logtail configuration and click Manage Logtail Configuration in the Actions column.
On the Logtail configuration page, click Edit.
This topic describes only common processing plugins that cover common log processing scenarios. For more features, see Extended processing plugins.
For Logtail 2.0 and later, and for the LoongCollector component, follow these plugin combination rules:
Use native plugins first.
If native plugins cannot meet your needs, configure extended plugins after the native plugins.
Native plugins can be used only before extended plugins.
Structured configuration
Regular expression parsing
Use regular expressions to extract log fields and parse the log into key-value pairs.
| Raw log: |
Custom regular expression parsing: Regular expression |
Delimiter-based parsing
Use a delimiter to structure the log content and parse it into multiple key-value pairs. Both single-character and multi-character delimiters are supported.
Click Add Processor, and select > :
| Raw log: |
Split fields by the specified character |
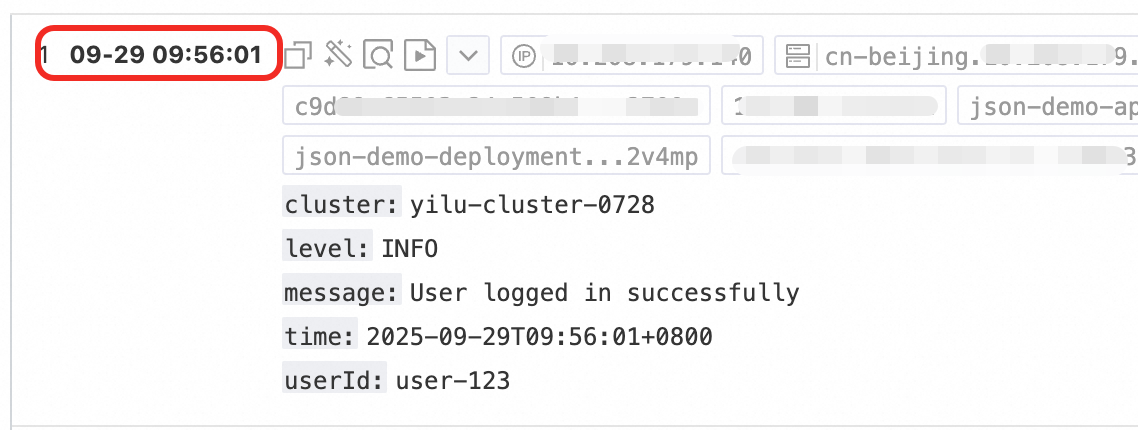
Standard JSON parsing
Structure an object-type JSON log and parse it into key-value pairs.
Click Add Processor, and select :
| Raw Log: |
Standard JSON key-value pairs are automatically extracted: |
Nested JSON parsing
Parse a nested JSON log into key-value pairs by specifying the expansion depth.
Click Add Processor and select :
| Raw log: |
Expansion depth: 0, with the expansion depth used as a prefix. | |
Expansion depth: 1, with the expansion depth used as a prefix. |
JSON array parsing
Use the json_extractfunction to extract JSON objects from a JSON array.
Set Processing Method to SPL:
| Raw log: |
Extracted JSON array structure: |
NGINX log parsing
Structure the log content into multiple key-value pairs based on the definition in log_format. If the default content does not meet your needs, you can use a custom format.
Click Add Processor, and select :
| Raw log: |
Parsed into key-value pairs based on the |
Apache log parsing
Structure the log content into multiple key-value pairs based on the definition in the Apache log configuration file.
Click Add Processor, and select :
| Raw log: |
Apache Common Log Format |
Data masking
Mask sensitive data in logs.
Click Add Processor, and select :
| Raw log: |
Masking result: |
Content filtering
Match log field values based on regular expressions and collect only logs that meet the whitelist conditions.
Click Add Processor, and select :
| Raw log: |
Filtered log: Set Field Name to |
Time parsing
Parse the time field in the log and set the parsing result as the log's __time__ field.
Click Add Processor and select :
| Raw log: |
Time parsing:
|
Other advanced configurations
When you create a collection configuration, after you complete the minimal configuration and common processing configurations, you can perform the following operations to further collect multiline logs, configure log topic types, and configure other settings. To modify an existing collection configuration, you can follow these steps:
In the navigation pane on the left, choose
 Logstores and find the target Logstore.
Click
 before its name to expand the Logstore.
Click Logtail Configurations. In the configuration list, find the target Logtail configuration and click Manage Logtail Configuration in the Actions column.
On the Logtail configuration page, click Edit.
Feature | Purpose |
Multiline log collection | Process cross-line logs such as Java stack traces |
Configure topic types | Set log topics based on machine groups, file paths, or custom rules to manage log sources by category |
Container filtering and blacklists |
|
Log tag enrichment | Add environment variables and container information as metadata fields |
Compression for log transmission | Enable |
Multiline log collection
By default, SLS works in single-line mode, treating each line of text as a separate log. This can incorrectly split multiline logs that contain content such as stack traces or JSON, which leads to a loss of context.
To address this issue, enable Multi-line Mode and define a Regex to Match First Line. This allows SLS to accurately identify the starting line of a complete log, which merges multiple lines into a single log entry.
Processor Configurations:
| Raw log: |
Single-line mode: Each line is a separate log, and the stack information is broken up, which loses context.
| |
Multi-line mode: A first-line regular expression identifies the complete log, which preserves the full semantic structure. |

Configure topic types
: Select the topic generation method.
Machine Group Topic: SLS lets you apply one collection configuration to multiple machine groups. When LoongCollector reports data, it uses the machine group's topic as the log topic and uploads it to the Logstore. You can use topics to distinguish logs from different machine groups.
File Path Extraction: If different users or applications write logs to different top-level directories but with the same subdirectory paths and filenames, it becomes difficult to distinguish the log source from the filename. In this case, you can configure File Path Extraction. Use a regular expression to match the full file path and use the matched result (username or application name) as the log topic to be uploaded to the Logstore.
NoteIn the regular expression for the file path, you must escape the forward slash (/).
Extract using a file path regular expression
Use case: Different users record logs in different directories, but the log filenames are the same. The directory paths are as follows.
/data/logs ├── userA │ └── serviceA │ └── service.log ├── userB │ └── serviceA │ └── service.log └── userC └── serviceA └── service.logIf you only configure the file path as
/data/logsand the filename asservice.login the Logtail Configuration, LoongCollector (Logtail) collects the content from all threeservice.logfiles into the same Logstore. This makes it impossible to distinguish which user produced which log. In this case, you can use a regular expression to extract values from the file path to generate different log topics.Regular expression
Extraction result
\/data\/logs\/(.*)\/serviceA\/.*__topic__: userA __topic__: userB __topic__: userCExtract using multiple capturing groups
Use case: If a single log topic is not enough to distinguish the source of the logs, you can configure multiple regular expression capturing groups in the log file path to extract key information. These capturing groups include named capturing groups (?P<name>) and unnamed capturing groups.
Named capturing group: The generated tag field is
__tag__:{name}.Unnamed capturing group: The generated tag field is
__tag__:__topic_{i}__, where{i}is the sequence number of the capturing group.
NoteWhen there are multiple capturing groups in the regular expression, the
__topic__field is not generated.For example, if the file path is
/data/logs/userA/serviceA/service.log, you can extract multiple values from the file path in the following ways:Example
Regular expression
Extraction result
Use an unnamed capturing group for regular expression extraction.
\/data\/logs\/(.*?)\/(.*?)\/service.log__tag__:__topic_1__: userA __tag__:__topic_2__: serviceAUse a named capturing group for regular expression extraction.
\/data\/logs\/(?P<user>.*?)\/(?P<service>.*?)\/service.log__tag__:user: userA __tag__:service: serviceAVerification: After the configuration is complete, you can query logs based on the log topic.
On the log query and analysis page, enter the corresponding generated log topic, such as
__topic__: userAor__tag__:__topic_1__: userA, to query logs for that topic.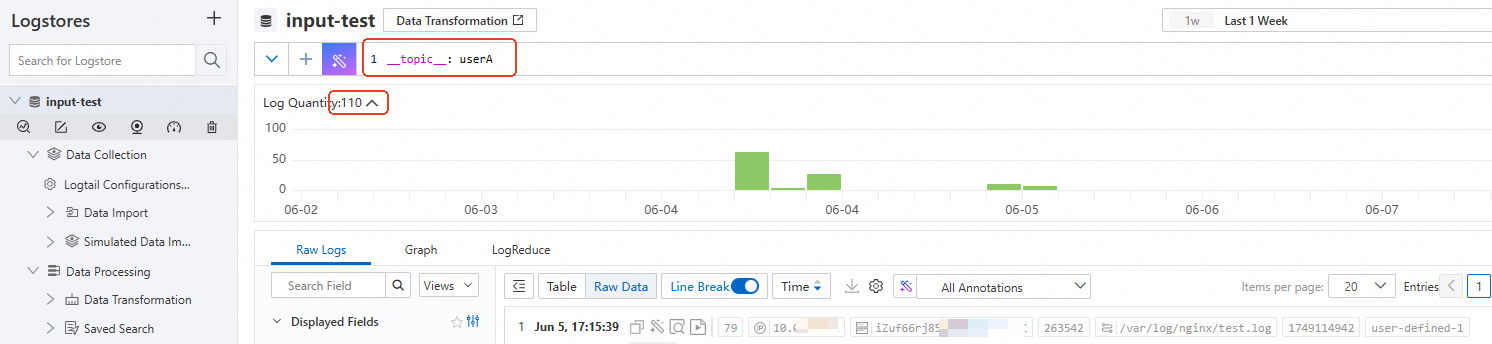
Custom: Enter
customized:// + custom topic nameto use a custom static log topic.
Container filtering and blacklists
Container filtering
Input Configurations:
Enable Container Filtering, click Add, select a filtering method, and configure it. Multiple conditions are combined with an "AND" relationship.
Environment Variable Blacklist/Whitelist: Specify the environment variable conditions for the containers from which to collect logs.
K8s Pod Label Blacklist/Whitelist: Specify the label conditions for the pod where the containers from which to collect logs are located.
K8s Pod Name Regex Match: Specify the containers from which to collect logs by pod name.
K8s Namespace Regex Match: Specify the containers from which to collect logs by namespace name.
K8s Container Name Regex Match: Specify the containers from which to collect logs by container name.
Container Label Blacklist/Whitelist: Collect logs from containers whose labels meet the conditions. This is used in Docker use cases and is not recommended for Kubernetes use cases.
Blacklist
: Enable Collection Blacklist, click Add, and configure the blacklist.
Supports full matching and wildcard matching for directories and filenames. Wildcard characters support only the asterisk (*) and the question mark (?).
File Path Blacklist: The file path to be ignored. Example:
/home/admin/private*.log: During collection, ignore all files in the/home/admin/directory that start with "private" and end with ".log"./home/admin/private*/*_inner.log: During collection, ignore files that end with "_inner.log" within directories that start with "private" under the/home/admin/directory.
File Blacklist: Configure the filenames to be ignored during collection. Example:
app_inner.log: During collection, ignore all files namedapp_inner.log.
Directory Blacklist: The directory path cannot end with a forward slash (/). Example:
/home/admin/dir1/: The directory blacklist will not take effect./home/admin/dir*: During collection, ignore files in subdirectories that start with "dir" under the/home/admin/directory./home/admin/*/dir: During collection, ignore all files in subdirectories named "dir" at the second level under the/home/admin/directory. For example, files in the/home/admin/a/dirdirectory are ignored, while files in the/home/admin/a/b/dirdirectory are collected.
Log tag enrichment
:
Enable Log Tag Enrichment and click Add:
Environment Variables: Configure an environment variable name and a tag name. The environment variable value is stored in the tag name.
Environment Variable Name: Specify the name of the environment variable to be extracted.
Tag Name: The name of the environment variable tag.
Pod Labels: Configure a pod label name and a tag name. The pod label value is stored in the tag name.
Pod Label Name: The name of the Kubernetes pod label to be extracted.
Tag Name: The name of the tag.
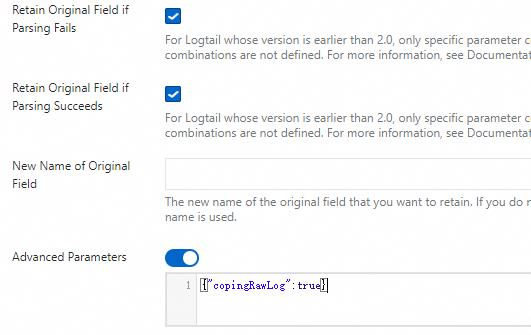
Compression for log transmission
:
Only Logtail 1.3.4 and later support zstd compression.
lz4: Fast compression speed, lower compression ratio.
zstd: High compression ratio, slightly lower speed, high memory usage.
What to do next
Log query and analysis: Each collected container text log contains the following default field information:
Field
Description
__tag__:__hostname__
The name of the container's host.
__tag__:__path__
The path of the log file within the container.
__tag__:_container_ip_
The IP address of the container.
__tag__:_image_name_
The name of the image used by the container.
__tag__:_pod_name_
The name of the pod.
__tag__:_namespace_
The namespace to which the pod belongs.
__tag__:_pod_uid_
The unique identifier (UID) of the pod.
Data visualization: Use visualization dashboards to monitor key metric trends.
Automatic alerting for data anomalies: Set alert policies to detect system anomalies in real time.
Troubleshooting: No data collected from container logs
Check for new logs: After you configure LoongCollector (Logtail) for collection, if there are no new logs in the target log file, LoongCollector (Logtail) does not collect data from that file.
Check the machine group heartbeat status: Go to the ![]() Resources > Machine Groups page, and click the name of the target machine group. In the section, view the Heartbeat status and record the number of nodes with an OK heartbeat status.
Resources > Machine Groups page, and click the name of the target machine group. In the section, view the Heartbeat status and record the number of nodes with an OK heartbeat status.
Check the number of worker nodes in the container cluster.
Obtain the cluster KubeConfig and connect to the cluster using kubectl.
View the number of worker nodes in the cluster.
kubectl get node | grep -v masterThe system returns a result similar to the following.
NAME STATUS ROLES AGE VERSION cn-hangzhou.i-bp17enxc2us3624wexh2 Ready <none> 238d v1.10.4 cn-hangzhou.i-bp1ad2b02jtqd1shi2ut Ready <none> 220d v1.10.4
Compare whether the number of nodes with an OK heartbeat status is consistent with the number of worker nodes in the container cluster. Choose a troubleshooting method based on the comparison result.
The heartbeat status of all nodes in the machine group is Failed:
If it is a self-managed cluster, check whether the following parameters are configured correctly:
{regionId},{aliuid},{access-key-id}, and{access-key-secret}.If they are incorrect, run the
helm del --purge alibaba-log-controllercommand to delete the installation package, and then reinstall.
The number of nodes with an OK heartbeat status is less than the number of worker nodes in the cluster.
Determine whether a DaemonSet was manually deployed using a YAML file.
Run the following command. If a result is returned, it means a DaemonSet was previously deployed manually using a YAML file.
kubectl get po -n kube-system -l k8s-app=logtailConfigure parameters such as ${your_region_name}, ${your_aliyun_user_id}, and ${your_machine_group_name} based on actual values.
Update the resource.
kubectl apply -f ./logtail-daemonset.yaml
FAQ
How do I send ACK cluster logs to a project in another Alibaba Cloud account?
Manually install the LoongCollector (Logtail) component in the ACK cluster and configure it with the target account's Alibaba Cloud account ID or access credential (AccessKey). This enables you to send container logs to a Simple Log Service project in another Alibaba Cloud account.
Use case: Collect log data from an ACK cluster to a Simple Log Service project in a different Alibaba Cloud account for reasons such as organizational structure, permission isolation, or unified monitoring. You can manually install LoongCollector (Logtail) for cross-account configuration.
Procedure: The following procedure uses the manual installation of LoongCollector as an example. To learn how to install Logtail, see Install and configure Logtail.
Connect to the Kubernetes cluster. Select the command for your region to download LoongCollector and its dependent components:
Regions in China:
wget https://aliyun-observability-release-cn-shanghai.oss-cn-shanghai.aliyuncs.com/loongcollector/k8s-custom-pkg/3.0.12/loongcollector-custom-k8s-package.tgz; tar xvf loongcollector-custom-k8s-package.tgz; chmod 744 ./loongcollector-custom-k8s-package/k8s-custom-install.shRegions outside China:
wget https://aliyun-observability-release-ap-southeast-1.oss-ap-southeast-1.aliyuncs.com/loongcollector/k8s-custom-pkg/3.0.12/loongcollector-custom-k8s-package.tgz; tar xvf loongcollector-custom-k8s-package.tgz; chmod 744 ./loongcollector-custom-k8s-package/k8s-custom-install.shGo to the
loongcollector-custom-k8s-packagedirectory and modify the./loongcollector/values.yamlconfiguration file.# ===================== Required Information ===================== # The name of the project where logs from this cluster will be collected, for example, k8s-log-custom-sd89ehdq projectName: "" # The region of the project, for example, Shanghai: cn-shanghai region: "" # The UID of the Alibaba Cloud account that owns the project. Enclose it in quotation marks, for example, "123456789" aliUid: "" # The network to use. Optional parameters: Internet, Intranet. The default is Internet. net: Internet # The AccessKey ID and AccessKey secret of the Alibaba Cloud account or RAM user. The account must have the AliyunLogFullAccess system policy permission. accessKeyID: "" accessKeySecret: "" # A custom cluster ID. The name can contain only uppercase letters, lowercase letters, digits, and hyphens (-). clusterID: ""In the
loongcollector-custom-k8s-packagedirectory, run the following command to install LoongCollector and other dependent components:bash k8s-custom-install.sh installAfter the installation is complete, check the running status of the components.
If a pod fails to start, check whether the values.yaml configuration is correct and whether the relevant images were pulled successfully.
# Check the pod status kubectl get po -n kube-system | grep loongcollector-dsSLS also automatically creates the following resources. You can log on to the Simple Log Service console to view them.
Resource type
Resource name
Function
Project
The value of
projectNamedefined in the values.yaml fileA resource management unit that isolates logs of different services.
To create a Project for more flexible log resource management, see Create a Project.
Machine group
k8s-group-${cluster_id}A collection of log collection nodes.
Logstore
config-operation-logImportantDo not delete this Logstore.
Stores logs of the loongcollector-operator component. Its billing method is the same as that of a regular Logstore. For more information, see Pay-by-data-written billable items. We recommend that you do not create collection configurations in this Logstore.
How can I collect logs from the same file or container standard output using multiple collection configurations?
By default, to prevent data duplication, SLS restricts each log source to be collected by only one collection configuration:
A text log file can match only one Logtail collection configuration.
A container's standard output (stdout) can also be collected by only one standard output collection configuration.
Log on to the Simple Log Service console and go to the target project.
In the navigation pane on the left, choose
Logstores and find the target Logstore.Click
before its name to expand the Logstore.Click Logtail Configurations. In the configuration list, find the target Logtail configuration and click Manage Logtail Configuration in the Actions column.
On the Logtail configuration page, click Edit and scroll down to the Input Configurations section:
To collect text file logs: Enable Allow File to Be Collected Multiple Times.
To collect container standard output: Enable Allow Collection by Different Logtail Configurations.
More information
Global configuration parameters
Input configuration parameters
Processor configuration parameters
Parameter | Description |
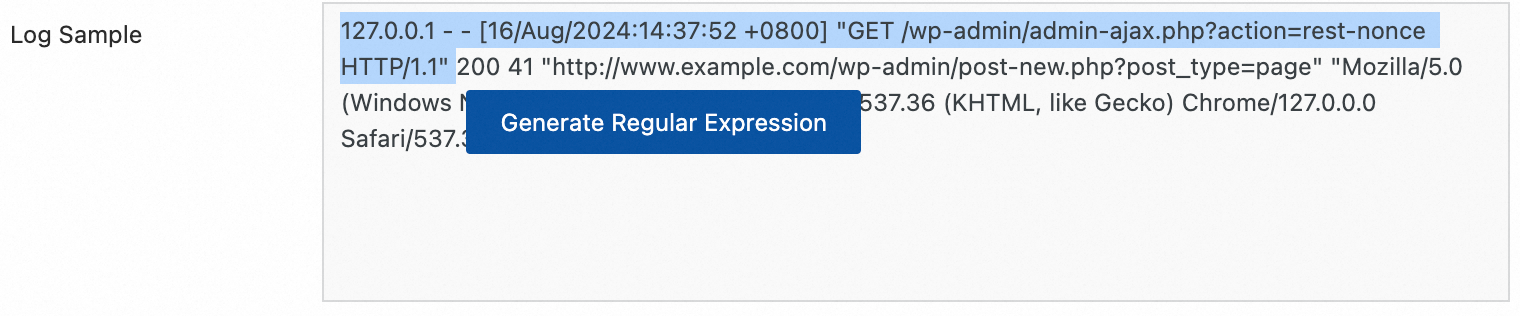
Log Sample | A sample of the log to be collected. Use a log from your actual scenario. The log sample helps configure log processing parameters and reduces configuration difficulty. You can add multiple samples, with a total length not exceeding 1500 characters. |
Multi-line Mode |
|
Processing Mode | Processors, which includes Native Plugins and Extended Plugins. For more information, see Overview of Logtail plugins for data processing. Important For limitations on the use of processing plugins, refer to the prompts on the console page.
|