Tips and Tricks, Making Sense of Big Data
This is yet another post on how to speed up matplotlib. And it’s not like I am ranting against matplotlib. In fact, it is a daily driver in my projects. But sometimes you need that little extra performance.
Here’s one example. For one of my studies, I had to create plenty of violin plots. For those unfamiliar with them, here’s a very brief and oversimplified explanation: Basically, the plots are in some ways similar to histograms but you can actually compare multiple violins in one plot, which is quite hard with histograms. Instead of computing discrete frequencies, violin plots compute the kernel density estimate (KDE) for each axis in question (a continuous function). And then they just plot the resulting polygons. The plotting is rather computationally cheap, but computing the KDE is not. I was dealing with hundreds of millions of data points and multiple axes. So, performance was key. The KDE of each axis can be computed independently and even the plotting could be done independently (on a shared axis). But matplotlib does it sequentially – ugh!
I started playing around to get matplotlib working with multiprocessing but I didn’t want to only parallelize KDE computation but any kind of plot that can be separated into multiple plots. Matplotlib is not really thread-safe so most of my approaches failed. I am sure there is some nifty way to achieve parallelism and perhaps I wasn’t digging deep enough but I wanted a simple solution to a simple problem and came up with a cheap trick.
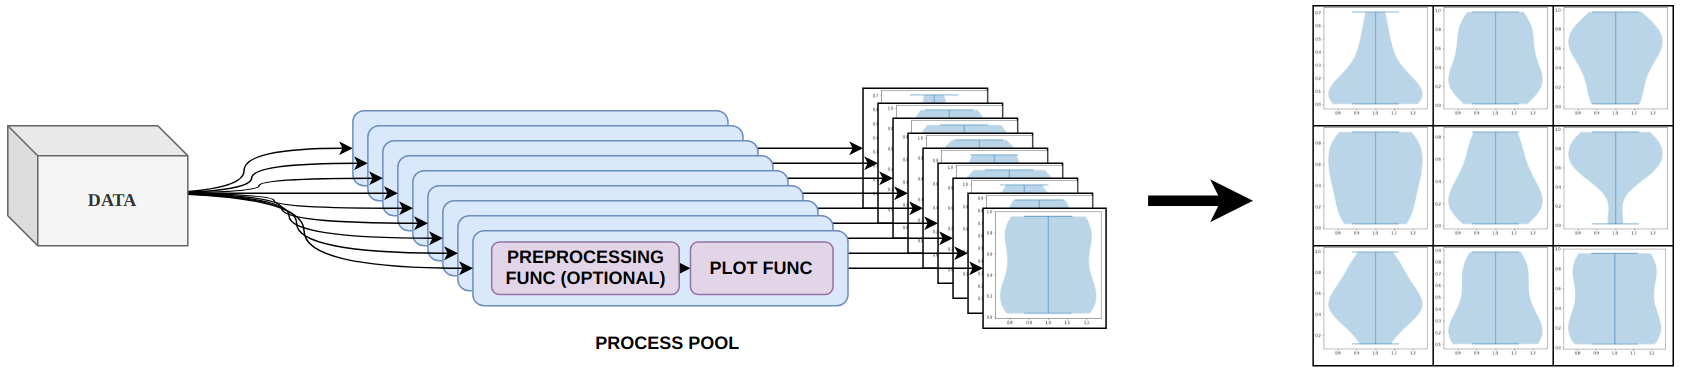
Instead of parallelizing the internals of matplotlib I distribute my data to different processes and then let every process create its own plot. Each plot is then rasterized and fed back to the main process which assembles all resulting subplots into one grid-like plot.
The output is a full matplotlib plot – you could even feed it into a QT backend and enjoy all the functionality of a GUI. But every subplot is a rasterized image. Which means you can’t zoom in, change axis etc. However, if you just need a fast way to create static plots then this approach should work for you.
I published this side-project on GitHub but haven’t published it on PyPi, yet. If you just want to use it, you can stop reading here and just install the library. Follow the GitHub readme for usage info.
pip install git+https://github.com/paulgavrikov/parallel-matplotlib-grid/But if you’re curious I’ll also explain the principle with a slightly stripped-down functionality. Let’s dig into it.
First, we have to distribute the data to every worker and then assemble the outputs. We can let multiprocessing handle that by using Pool. And assembling means we just create subplots and let every plot show the rasterized output via plt.imshow.
Now, it’s time to define the worker. The worker has to create a plot, call a user-defined function that will plot the data to the figure in whatever way, and then rasterize and return the output.
matplotlib is not very good at computing the bounds of every plot before saving. Either you accept subplots that may be missing a bit of the plot or use padding (done by default).
And now you can call parallel_plot with your data and your custom plotting routine and enjoy quasi-parallel plotting.
Let’s create a 5×5 grid of violins:

Or a row of 5 scatter plots:

You can create any plot you like as long as your plot on the provided fig and axes arguments. Just remember that multiprocessing cannot handle data well that exceeds 4GiB.
A little side note. I am well aware that multiprocessing is not the creme de la creme when it comes to actual parallelism. But it works good enough for most cases and my primary usage are jupyter notebooks where I found multiprocessing to be one of the few libraries to work reliably. If you want to use it outside of jupyter and would like to share larger data with workers you may want to consider using ray.
ray does not use pickle to serialize data. So, serialization is faster and you can serialize data that is bigger than 4GiB. Accessing the data is also faster since there is no expensive deserialization. But I also had problems with lots of dead processes that occupy RAM and never got it to work within a jupyter notebook.


