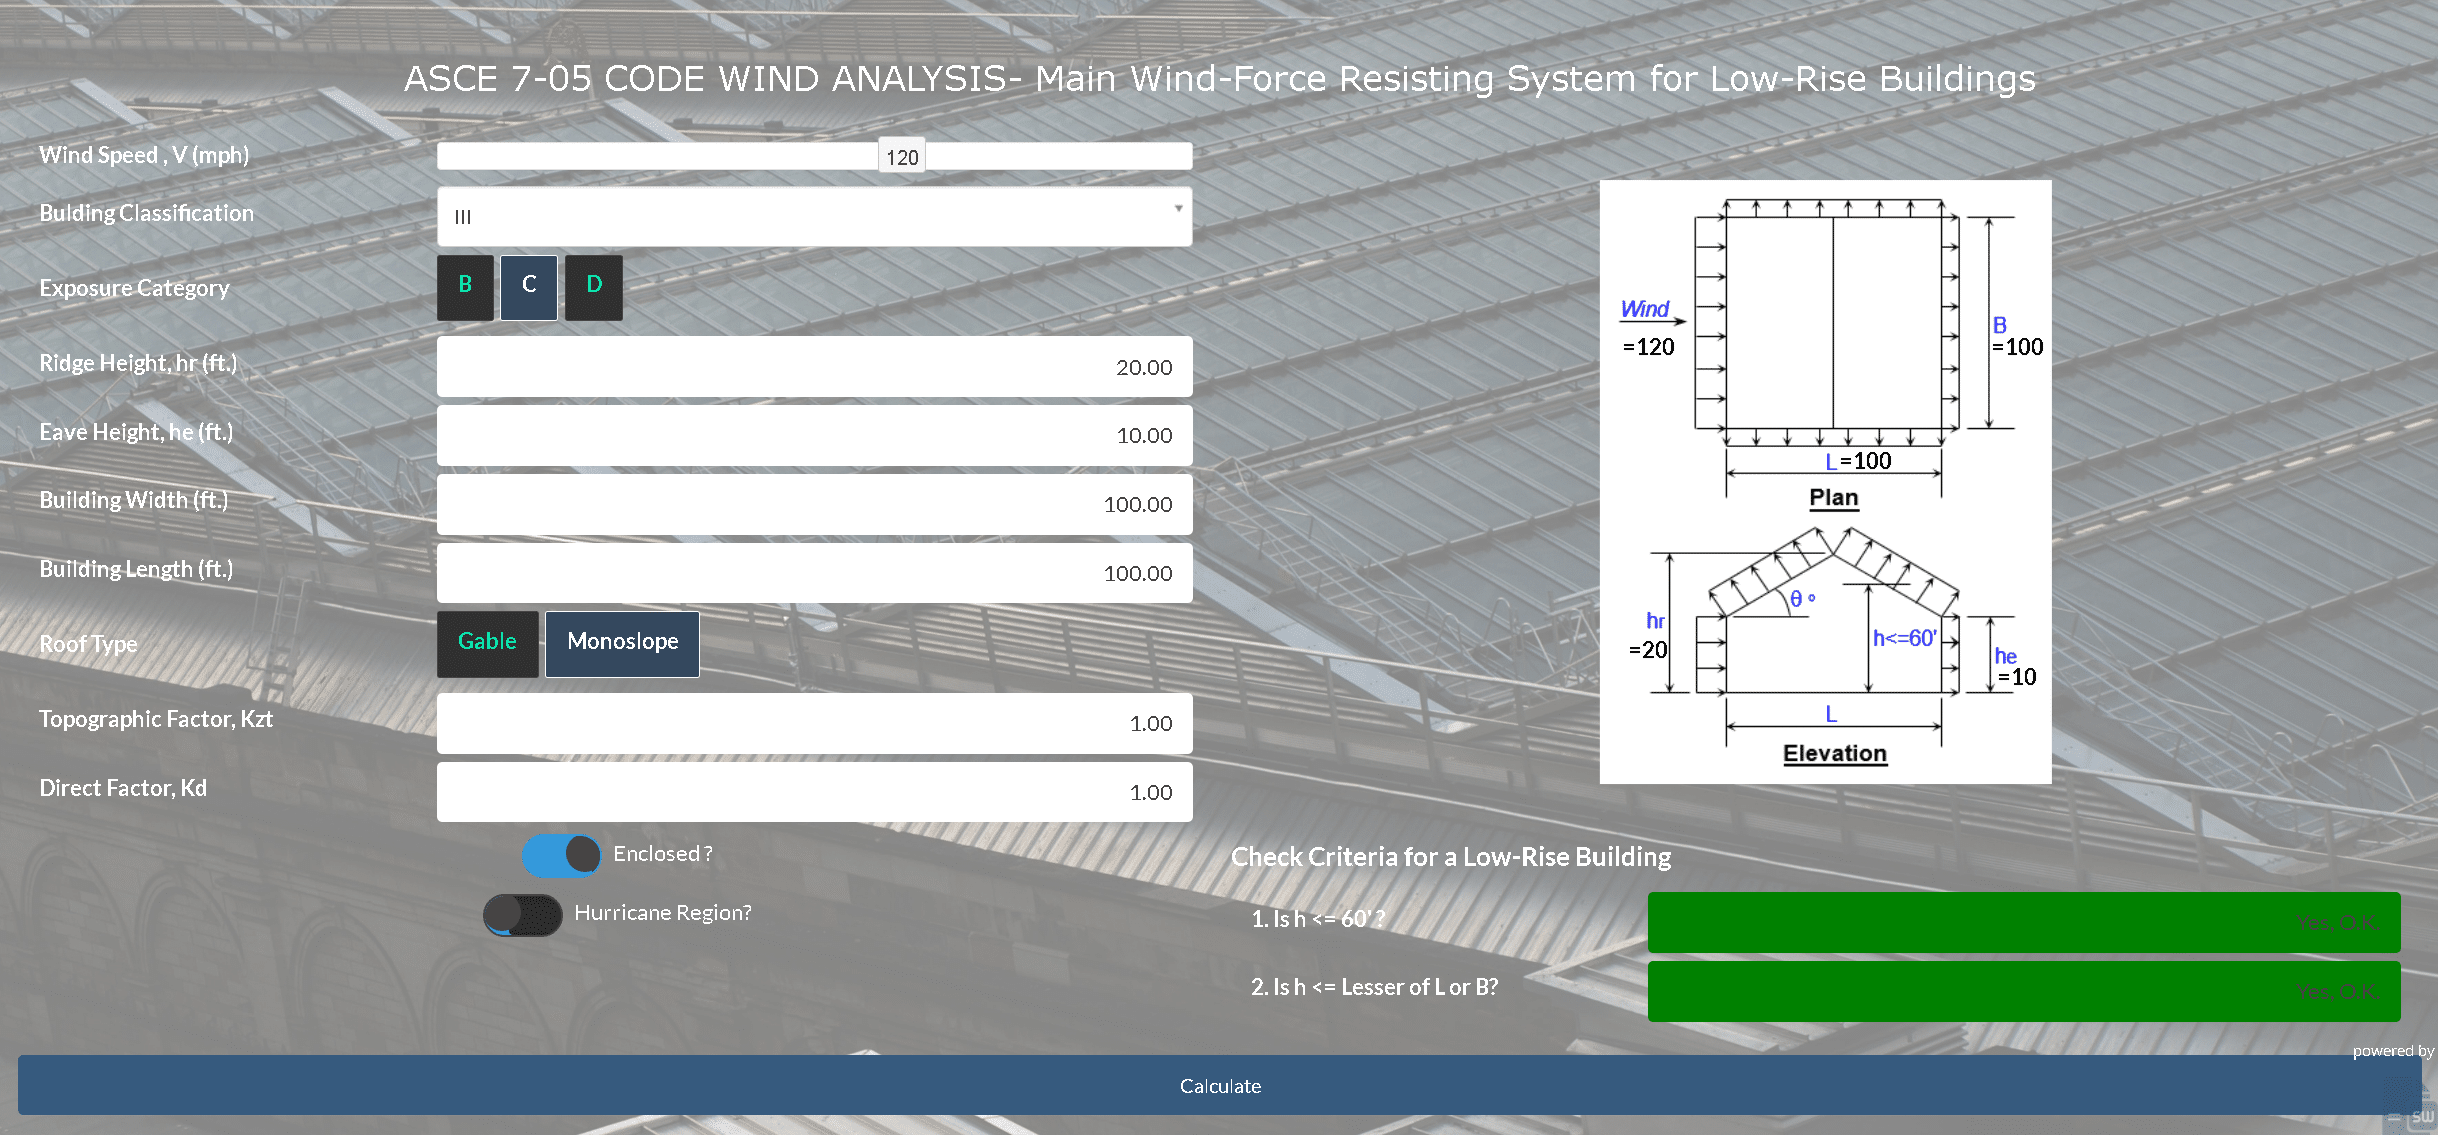
In this guide, we will explore how to overlay dynamic data from an Excel sheet onto an image using SpreadsheetWeb's scripting capabilities. This process is especially valuable for embedding dynamic data into engineering drawings, such as measurements, or for any application that requires accurate data placement on diagrams or schematics.We will use a sample wind load analysis spreadsheet as an example to demonstrate this process.
Overview
The objective of this implementation is to:
- Dynamically extract and process data from an Excel file uploaded to SpreadsheetWeb.
- Map percentage-based coordinates to pixel positions on an image.
- Overlay the extracted values onto the image dynamically.
- Ensure the system is responsive, maintaining consistent placement across different screen resolutions.
Using the provided example Excel data, we will integrate a wind load analysis into the visualization. This application highlights how SpreadsheetWeb's scripting and UI design capabilities can transform static data into interactive, visually appealing applications.
Step 1: Understanding the Excel Data
The provided Excel sheet contains data organized as follows:
| Column | Description |
| X | Horizontal position (percentage of width) |
| Y | Vertical position (percentage of height) |
| Value | Data to display (e.g., wind speed) |
Example Data:
| X (%) | Y (%) | Value |
| 80.00 | 28.00 | 90 |
| 80.00 | 78.00 | 53.33 |
| 160.00 | 83.00 | 20 |
| 160.00 | 30.00 | 200 |
| 129.00 | 47.40 | 250 |
This data will be used to overlay wind speed and other parameters at specified locations on the building diagram. The percentages define relative positions on the image, making the system scalable and adaptable.
Step 2: Uploading and Linking the Excel File
- Upload the Excel File: In SpreadsheetWeb Designer, upload the Excel file and define a named range for the relevant table. For example, name the range windData.
- Map to Grid: Create a grid in SpreadsheetWeb and map it to the windData named range. This ensures the script can dynamically access and manipulate the data.
- Verify Data Access: Use SpreadsheetWeb's debugging tools to confirm that the grid is properly linked and the data is accessible.
Step 3: Writing the Script for Dynamic Data
The following JavaScript processes the grid data and places overlays on the image based on percentage-based coordinates:
// Access the linked Excel grid in SpreadsheetWeb var inputGrid1 = pagosApp.inputGrids.byNameRange("windData"); function updateGridValues() { var gridValues = inputGrid1.value(); if (!Array.isArray(gridValues)) { console.error("Unexpected format in grid values:", gridValues); return; } // Target the image container and background image var imageContainer = document.querySelector(".image-container"); var backgroundImage = document.querySelector(".background-image"); if (!imageContainer || !(backgroundImage instanceof HTMLImageElement)) { console.error("Image elements not found in the DOM!"); return; } // Clear existing overlays (excluding the image) Array.from(imageContainer.children).forEach(child => { if (!child.classList.contains("background-image")) { imageContainer.removeChild(child); } }); // Get dimensions for scaling var containerWidth = imageContainer.clientWidth; var containerHeight = imageContainer.clientHeight; var naturalWidth = backgroundImage.naturalWidth; var naturalHeight = backgroundImage.naturalHeight; var scale = Math.min(containerWidth / naturalWidth, containerHeight / naturalHeight); var imageWidth = naturalWidth * scale; var imageHeight = naturalHeight * scale; var offsetX = (containerWidth - imageWidth) / 2; var offsetY = (containerHeight - imageHeight) / 2; // Iterate over rows (skip header row) gridValues.slice(1).forEach(row => { if (row.length < 3) { console.error("Incomplete row data:", row); return; } var xPercent = parseFloat(row[0]); var yPercent = parseFloat(row[1]); var value = row[2]; // Calculate pixel positions var x = (xPercent / 100) * imageWidth + offsetX; var y = (yPercent / 100) * imageHeight + offsetY; // Create overlay element var valueElement = document.createElement("div"); valueElement.style.position = "absolute"; valueElement.style.left = `${x}px`; valueElement.style.top = `${y}px`; valueElement.style.transform = "translate(-50%, -50%)"; valueElement.style.background = "rgba(255, 255, 255, 0.8)"; valueElement.style.padding = "5px"; valueElement.style.borderRadius = "4px"; valueElement.style.fontSize = "14px"; valueElement.style.color = "black"; valueElement.style.textAlign = "center"; valueElement.innerText = value; // Append to the image container imageContainer.appendChild(valueElement); }); } // Update dynamically on window resize window.addEventListener("resize", updateGridValues); // Trigger updates on grid changes inputGrid1.on("change", updateGridValues); // Initial load updateGridValues();
Explanation:
- Grid Data Access: Dynamically fetches the windData grid values.
- Data Validation: Ensures valid data before processing.
- Overlay Placement: Converts percentage values to pixel positions based on the image dimensions.
- Responsiveness: Recalculates positions dynamically on window resize.
Step 4: Styling with CSS
The following CSS styles ensure the image and overlays are rendered properly:
.image-container { position: relative; width: 100%; height: 500px; overflow: hidden; border: 1px solid #ccc; } .background-image { position: absolute; top: 50%; left: 50%; transform: translate(-50%, -50%); max-width: 100%; max-height: 100%; }
Step 5: Adding HTML to the UI
Insert the following HTML into the SpreadsheetWeb Content Label:
<div class="image-container"> <img class="background-image" src="path/to/your/image.png" alt="Building Diagram"> </div>
This creates a container for the image and sets the foundation for dynamic overlays.
Step 6: Ensuring Responsiveness
To maintain a consistent experience across devices, the script:
- Calculates Scaling Factor: Dynamically adjusts pixel positions based on the image’s dimensions.
- Handles Window Resizing: Recalculates overlay positions when the browser window size changes.
Step 7: Testing and Validation
- Data Testing: Populate the grid with various values to ensure accurate placement.
- Resize Testing: Verify overlays adjust seamlessly on different screen sizes.
- Error Handling: Test with incomplete or invalid data to confirm robust error handling.
Conclusion
By integrating Excel data into a dynamic visualization, this implementation demonstrates the power of SpreadsheetWeb. The combination of scripting, responsive design, and data integration allows for interactive and scalable applications that enhance user experience. This approach can be extended to various industries, such as engineering, logistics, and interactive reporting.


