Scatterplot with continuous hues and sizes#
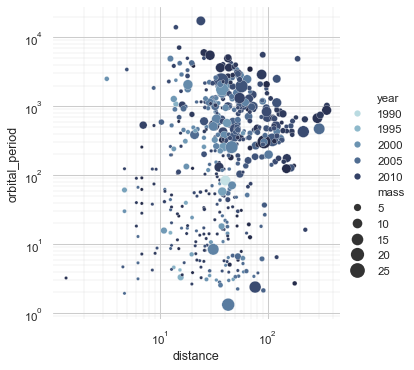
seaborn components used: set_theme(), load_dataset(), cubehelix_palette(), relplot()
import seaborn as sns sns.set_theme(style="whitegrid") # Load the example planets dataset planets = sns.load_dataset("planets") cmap = sns.cubehelix_palette(rot=-.2, as_cmap=True) g = sns.relplot( data=planets, x="distance", y="orbital_period", hue="year", size="mass", palette=cmap, sizes=(10, 200), ) g.set(xscale="log", yscale="log") g.ax.xaxis.grid(True, "minor", linewidth=.25) g.ax.yaxis.grid(True, "minor", linewidth=.25) g.despine(left=True, bottom=True)