This is the multi-page printable view of this section. Click here to print.
Observability in EKS Anywhere
- 1: Overview
- 2: Verify EKS Anywhere cluster status
- 3: Connect EKS Anywhere clusters to the EKS console
- 4: Configure Fluent Bit for CloudWatch
- 5: Expose metrics for EKS Anywhere components
1 - Overview
Most Kubernetes-conformant observability tools can be used with EKS Anywhere. You can optionally use the EKS Connector to view your EKS Anywhere cluster resources in the Amazon EKS console, reference the Connect to console page for details. EKS Anywhere includes the AWS Distro for Open Telemetry (ADOT) and Prometheus for metrics and tracing as EKS Anywhere Curated Packages. You can use popular tooling such as Fluent Bit for logging, and can track the progress of logging for ADOT on the AWS Observability roadmap . For more information on EKS Anywhere Curated Packages, reference the Package Management Overview .
AWS Integrations
AWS offers comprehensive monitoring, logging, alarming, and dashboard capabilities through services such as Amazon CloudWatch , Amazon Managed Prometheus (AMP) , and Amazon Managed Grafana (AMG) . With CloudWatch, you can take advantage of a highly scalable, AWS-native centralized logging and monitoring solution for EKS Anywhere clusters. With AMP and AMG, you can monitor your containerized applications EKS Anywhere clusters at scale with popular Prometheus and Grafana interfaces.
Resources
2 - Verify EKS Anywhere cluster status
Note
- To check the status of a single cluster, configure
kubectlto communicate with the cluster by setting theKUBECONFIGenvironment variable to point to your cluster’skubeconfigfile. - To check the status of workload clusters from a management cluster, configure
kubectlwith thekubeconfigof the management cluster.
Check cluster nodes
To verify the expected number of cluster nodes are present and running, use the kubectl command to show that nodes are Ready.
Worker nodes are named using the cluster name followed by the worker node group name. In the example below, the cluster name is mgmt and the worker node group name is md-0. The other nodes shown in the response are control plane or etcd nodes.
kubectl get nodes NAME STATUS ROLES AGE VERSION mgmt-clrt4 Ready control-plane 3d22h v1.27.1-eks-61789d8 mgmt-md-0-5557f7c7bxsjkdg-l2kpt Ready <none> 3d22h v1.27.1-eks-61789d8 Check cluster machines
To verify that the expected number of cluster machines are present and running, use the kubectl command to show that the machines are Running.
The machine objects are named using the cluster name as a prefix and there should be one created for each node in your cluster. In the example below, the command was run against a management cluster with a single attached workload cluster. When the command is run against a management cluster, all machines for the management cluster and attached workload clusters are shown.
kubectl get machines -A NAMESPACE NAME CLUSTER NODENAME PROVIDERID PHASE AGE VERSION eksa-system mgmt-clrt4 mgmt mgmt-clrt4 vsphere://421a801c-ac46-f47e-de1f-f070ef990c4d Running 3d22h v1.27.1-eks-1-27-4 eksa-system mgmt-md-0-5557f7c7bxsjkdg-l2kpt mgmt mgmt-md-0-5557f7c7bxsjkdg-l2kpt vsphere://421a4b9b-c457-fc4d-458a-d5092f981c5d Running 3d22h v1.27.1-eks-1-27-4 eksa-system w01-7hzfh w01 w01-7hzfh vsphere://421a642b-f4ef-5764-47f9-5b56efcf8a4b Running 15h v1.27.1-eks-1-27-4 eksa-system w01-etcd-z2ggk w01 vsphere://421ac003-3a1a-7dd9-ac83-bd0c75370cc4 Running 15h eksa-system w01-md-0-799ffd7946x5gz8w-p94mt w01 w01-md-0-799ffd7946x5gz8w-p94mt vsphere://421a7b77-ca57-dc78-18bf-f361081a2c5e Running 15h v1.27.1-eks-1-27-4 Check cluster components
To verify cluster components are present and running, use the kubectl command to show that the system Pods are Running. The number of Pods may vary based on the infrastructure provider (vSphere, bare metal, Snow, Nutanix, CloudStack), and whether the cluster is a workload cluster or a management cluster.
kubectl get pods -A NAMESPACE NAME READY STATUS RESTARTS AGE capi-kubeadm-bootstrap-system capi-kubeadm-bootstrap-controller-manager-8665b88c65-v982t 1/1 Running 0 3d22h capi-kubeadm-control-plane-system capi-kubeadm-control-plane-controller-manager-67595c55d8-z7627 1/1 Running 0 3d22h capi-system capi-controller-manager-88bdd56b4-wnk66 1/1 Running 0 3d22h capv-system capv-controller-manager-644d9864dc-hbrcz 1/1 Running 1 (16h ago) 3d22h cert-manager cert-manager-548579646f-4tgb2 1/1 Running 0 3d22h cert-manager cert-manager-cainjector-cbb6df554-w5fjx 1/1 Running 0 3d22h cert-manager cert-manager-webhook-54f748c89b-qnfr2 1/1 Running 0 3d22h eksa-packages ecr-credential-provider-package-4c7mk 1/1 Running 0 3d22h eksa-packages ecr-credential-provider-package-nvlkb 1/1 Running 0 3d22h eksa-packages eks-anywhere-packages-784c6fc8b9-2t5nr 1/1 Running 0 3d22h eksa-system eksa-controller-manager-76f484bd5b-x6qld 1/1 Running 0 3d22h etcdadm-bootstrap-provider-system etcdadm-bootstrap-provider-controller-manager-6bcdd4f5d7-wvqw8 1/1 Running 0 3d22h etcdadm-controller-system etcdadm-controller-controller-manager-6f96f5d594-kqnfw 1/1 Running 0 3d22h kube-system cilium-lbqdt 1/1 Running 0 3d22h kube-system cilium-operator-55c4778776-jvrnh 1/1 Running 0 3d22h kube-system cilium-operator-55c4778776-wjjrk 1/1 Running 0 3d22h kube-system cilium-psqm2 1/1 Running 0 3d22h kube-system coredns-69797695c4-kdtjc 1/1 Running 0 3d22h kube-system coredns-69797695c4-r25vv 1/1 Running 0 3d22h kube-system etcd-mgmt-clrt4 1/1 Running 0 3d22h kube-system kube-apiserver-mgmt-clrt4 1/1 Running 0 3d22h kube-system kube-controller-manager-mgmt-clrt4 1/1 Running 0 3d22h kube-system kube-proxy-588gj 1/1 Running 0 3d22h kube-system kube-proxy-hrksw 1/1 Running 0 3d22h kube-system kube-scheduler-mgmt-clrt4 1/1 Running 0 3d22h kube-system kube-vip-mgmt-clrt4 1/1 Running 0 3d22h kube-system vsphere-cloud-controller-manager-7vzjx 1/1 Running 0 3d22h kube-system vsphere-cloud-controller-manager-cqfs5 1/1 Running 0 3d22h Check control plane components
You can verify the control plane is present and running by filtering Pods by the control-plane=controller-manager label.
kubectl get pod -A -l control-plane=controller-manager NAMESPACE NAME READY STATUS RESTARTS AGE capi-kubeadm-bootstrap-system capi-kubeadm-bootstrap-controller-manager-8665b88c65-v982t 1/1 Running 0 3d21h capi-kubeadm-control-plane-system capi-kubeadm-control-plane-controller-manager-67595c55d8-z7627 1/1 Running 0 3d21h capi-system capi-controller-manager-88bdd56b4-wnk66 1/1 Running 0 3d21h capv-system capv-controller-manager-644d9864dc-hbrcz 1/1 Running 1 (15h ago) 3d21h eksa-packages eks-anywhere-packages-784c6fc8b9-2t5nr 1/1 Running 0 3d21h etcdadm-bootstrap-provider-system etcdadm-bootstrap-provider-controller-manager-6bcdd4f5d7-wvqw8 1/1 Running 0 3d21h etcdadm-controller-system etcdadm-controller-controller-manager-6f96f5d594-kqnfw 1/1 Running 0 3d21h Check workload clusters from management clusters
Set up CLUSTER_NAME and KUBECONFIG environment variable for the management cluster:
export CLUSTER_NAME=mgmt export KUBECONFIG=${CLUSTER_NAME}/${CLUSTER_NAME}-eks-a-cluster.kubeconfig Check control plane resources for all clusters
Use the command below to check the status of cluster control plane resources. This is useful to verify clusters with multiple control plane nodes after an upgrade. The status for the management cluster and all attached workload clusters is shown.
kubectl get kubeadmcontrolplanes.controlplane.cluster.x-k8s.io -n eksa-system NAME CLUSTER INITIALIZED API SERVER AVAILABLE REPLICAS READY UPDATED UNAVAILABLE AGE VERSION mgmt mgmt true true 1 1 1 3d22h v1.27.1-eks-1-27-4 w01 w01 true true 1 1 1 0 16h v1.27.1-eks-1-27-4 Use the command below to check the status of a cluster resource. This is useful to verify cluster health after any mutating cluster lifecycle operation. The status for the management cluster and all attached workload clusters is shown.
kubectl get clusters.cluster.x-k8s.io -A -o=custom-columns=NAME:.metadata.name,CONTROLPLANE-READY:.status.controlPlaneReady,INFRASTRUCTURE-READY:.status.infrastructureReady,MANAGED-EXTERNAL-ETCD-INITIALIZED:.status.managedExternalEtcdInitialized,MANAGED-EXTERNAL-ETCD-READY:.status.managedExternalEtcdReady NAME CONTROLPLANE-READY INFRASTRUCTURE-READY MANAGED-EXTERNAL-ETCD-INITIALIZED MANAGED-EXTERNAL-ETCD-READY mgmt true true <none> <none> w01 true true true true 3 - Connect EKS Anywhere clusters to the EKS console
The EKS Connector lets you connect your EKS Anywhere cluster to the EKS console. The connected console displays the EKS Anywhere cluster, its configuration, workloads, and their status. EKS Connector is a software agent that runs on your EKS Anywhere cluster and registers the cluster with the EKS console
Visit the EKS Connector documentation for details on how to configure and run the EKS Connector.
4 - Configure Fluent Bit for CloudWatch
Fluent Bit is an open source, multi-platform log processor and forwarder which allows you to collect data/logs from different sources, then unify and send them to multiple destinations. It’s fully compatible with Docker and Kubernetes environments. Due to its lightweight nature, using Fluent Bit as the log forwarder for EKS Anywhere clusters enables you to stream application logs into Amazon CloudWatch Logs efficiently and reliably.
You can additionally use CloudWatch Container Insights to collect, aggregate, and summarize metrics and logs from your containerized applications and microservices running on EKS Anywhere clusters. CloudWatch automatically collects metrics for many resources, such as CPU, memory, disk, and network. Container Insights also provides diagnostic information, such as container restart failures, to help you isolate issues and resolve them quickly. You can also set CloudWatch alarms on metrics that Container Insights collects.
On this page, we show how to set up Fluent Bit and Container Insights to send logs and metrics from your EKS Anywhere clusters to CloudWatch.
Prerequisites
- An AWS Account (see AWS documentation to get started)
- An EKS Anywhere cluster with IAM Roles for Service Account (IRSA) enabled: With IRSA, an IAM role can be associated with a Kubernetes service account. This service account can provide AWS permissions to the containers in any Pod that use the service account, which enables the containers to securely communicate with AWS services. This removes the need to hardcode AWS security credentials as environment variables on your nodes. See the IRSA configuration page for details.
Note
- The example uses
eksapocas the EKS Anywhere cluster name. You must adjust the configuration in the examples below if you use a different cluster name. Specifically, make sure to adjust thefluentbit.yamlmanifest accordingly. - The example uses the
us-west-2AWS Region. You must adjust the configuration in the examples below if you are using a different region.
Before setting up Fluent Bit, first create an IAM Policy and Role to send logs to CloudWatch.
Step 1: Create IAM Policy
-
Go to IAM Policy in the AWS console.
-
Click on JSON as shown below:
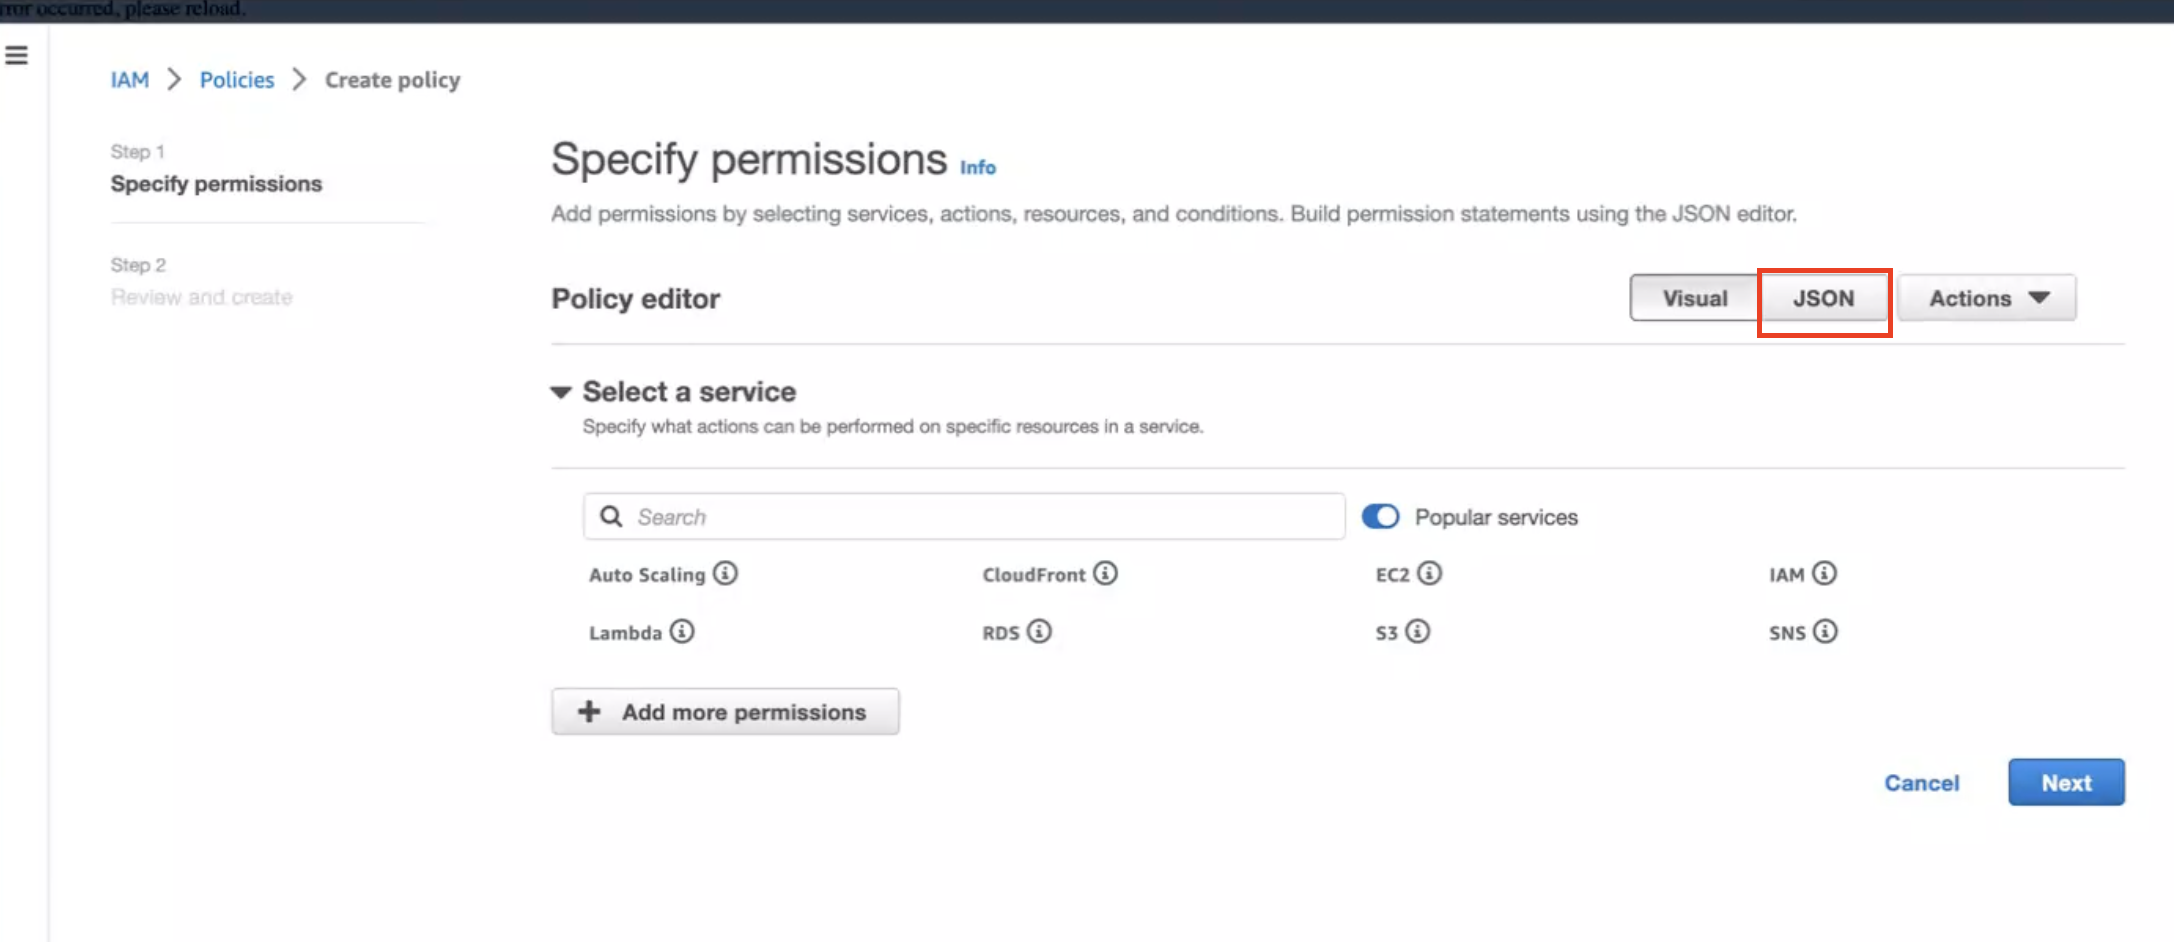
-
Create below policy on the IAM Console. Click on Create Policy as shown:
{ "Version": "2012-10-17", "Statement": [ { "Sid": "EKSAnywhereLogging", "Effect": "Allow", "Action": "cloudwatch:*", "Resource": "*" } ] } Step 2: Create IAM Role
-
Go to IAM Role in the AWS console.
-
Follow the steps as shown below:
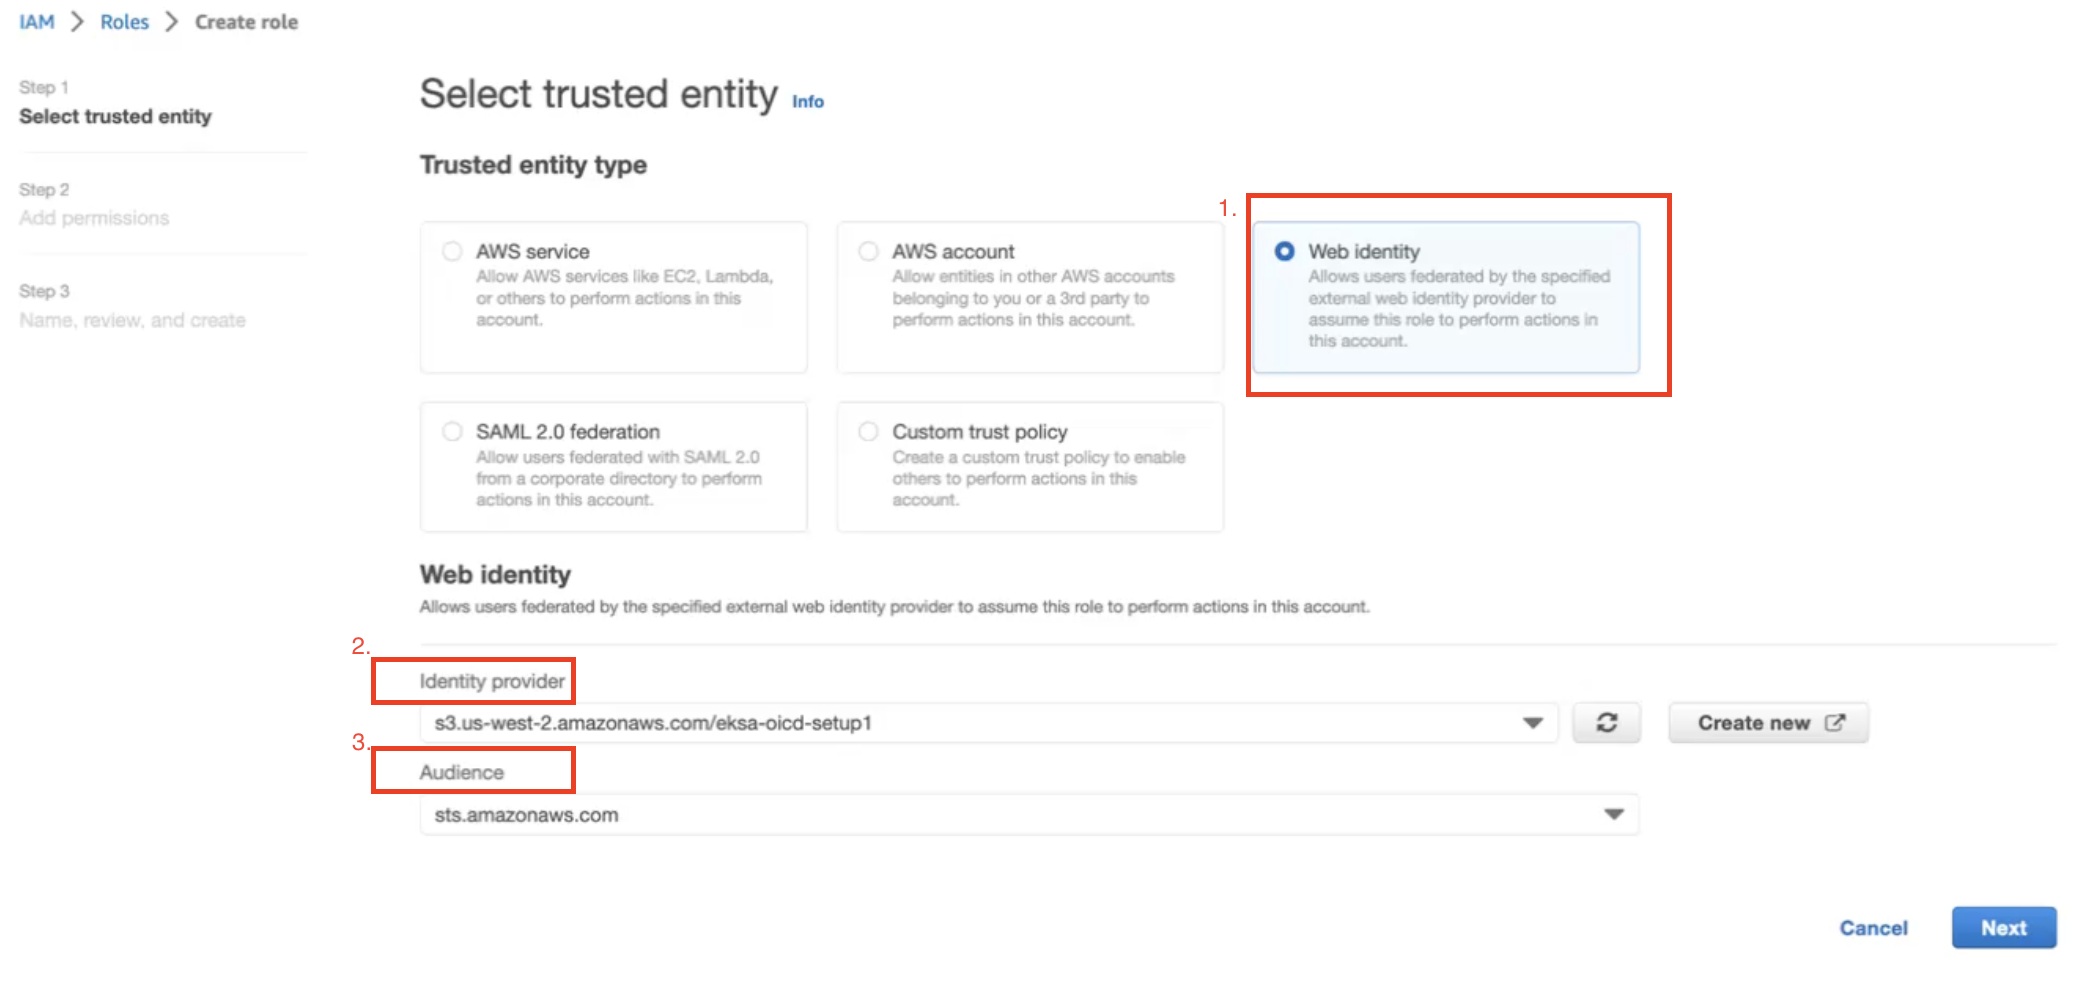
In Identity Provider, enter the OIDC provider you created as a part of IRSA configuration.
In Audience, select sts.amazonaws.com. Click on Next.
-
Select permission name which we have created in Create IAM Policy
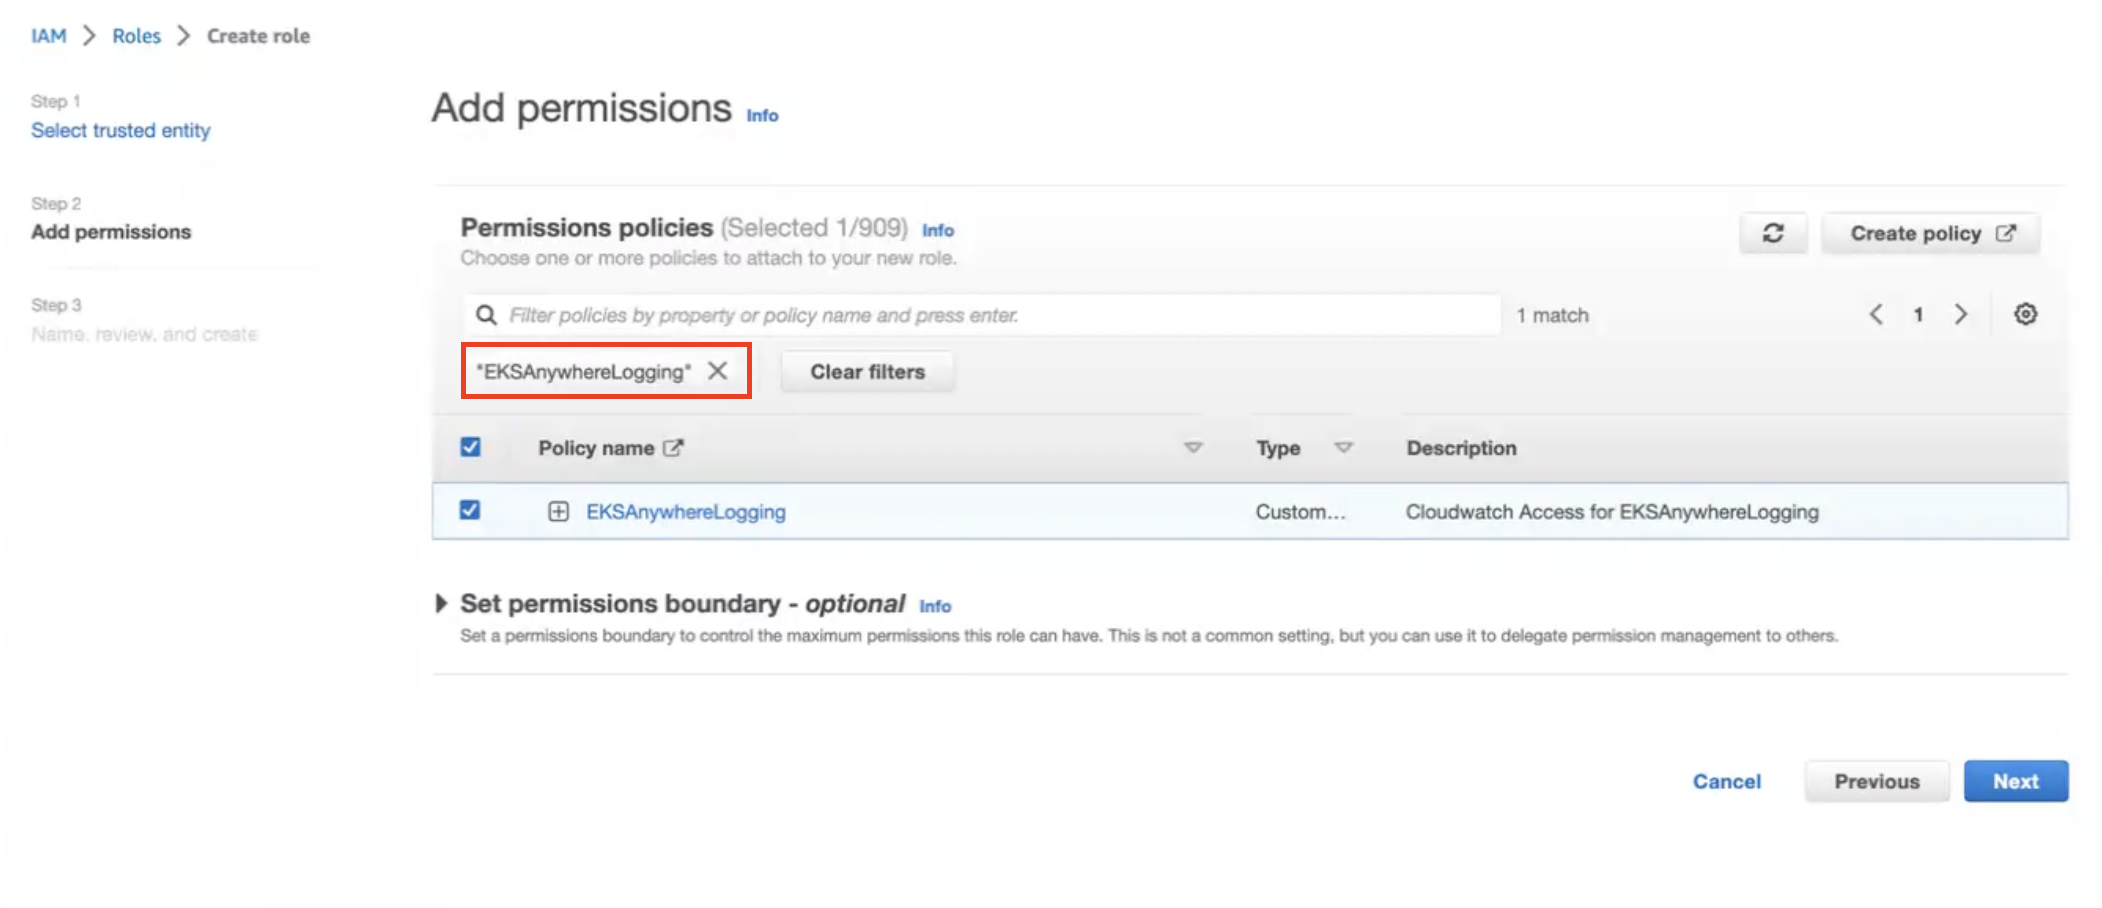
-
Provide a Role name
EKSAnywhereLoggingand click Next. -
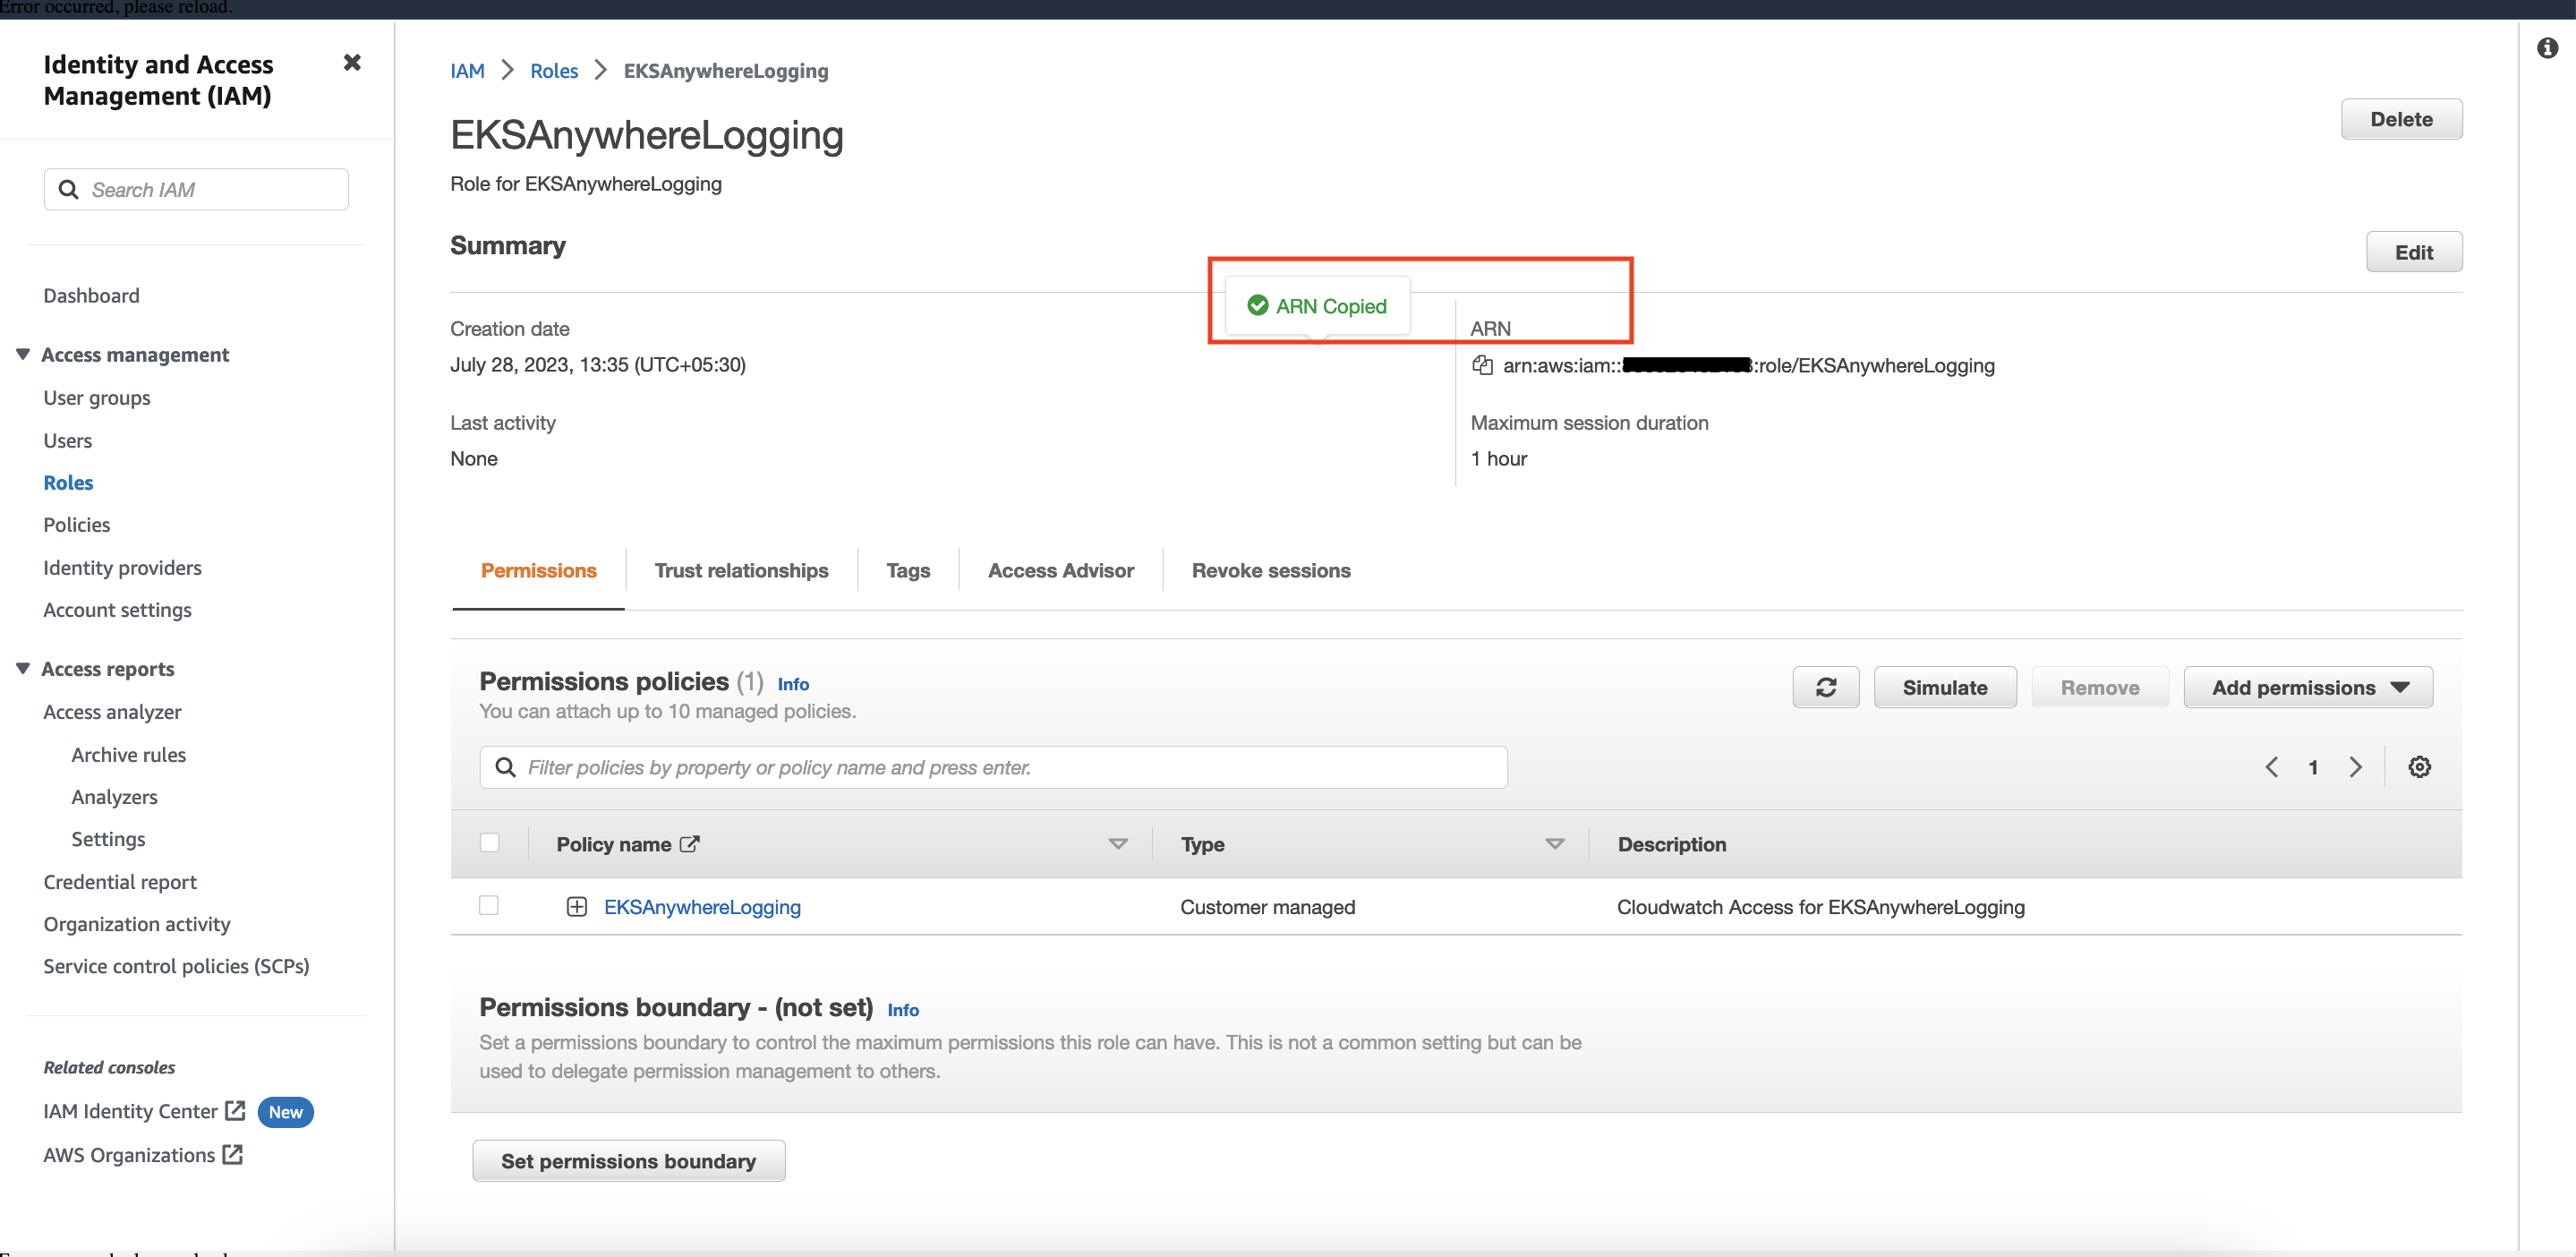
Copy the ARN as shown below and save it locally for the next step.
Step 3: Install Fluent Bit
-
Create the
amazon-cloudwatchnamespace using this command:kubectl create namespace amazon-cloudwatch -
Create the Service Account for
cloudwatch-agentandfluent-bitunder theamazon-cloudwatchnamespace. In this section, we will use Role ARN which we saved earlier . Replace$RoleARNwith your actual value.cat << EOF | kubectl apply -f - # create cwagent service account and role binding apiVersion: v1 kind: ServiceAccount metadata: name: cloudwatch-agent namespace: amazon-cloudwatch annotations: # set this with value of OIDC_IAM_ROLE eks.amazonaws.com/role-arn: "$RoleARN" # optional: Defaults to "sts.amazonaws.com" if not set eks.amazonaws.com/audience: "sts.amazonaws.com" # optional: When set to "true", adds AWS_STS_REGIONAL_ENDPOINTS env var # to containers eks.amazonaws.com/sts-regional-endpoints: "true" # optional: Defaults to 86400 for expirationSeconds if not set # Note: This value can be overwritten if specified in the pod # annotation as shown in the next step. eks.amazonaws.com/token-expiration: "86400" --- apiVersion: v1 kind: ServiceAccount metadata: name: fluent-bit namespace: amazon-cloudwatch annotations: # set this with value of OIDC_IAM_ROLE eks.amazonaws.com/role-arn: "$RoleARN" # optional: Defaults to "sts.amazonaws.com" if not set eks.amazonaws.com/audience: "sts.amazonaws.com" # optional: When set to "true", adds AWS_STS_REGIONAL_ENDPOINTS env var # to containers eks.amazonaws.com/sts-regional-endpoints: "true" # optional: Defaults to 86400 for expirationSeconds if not set # Note: This value can be overwritten if specified in the pod # annotation as shown in the next step. eks.amazonaws.com/token-expiration: "86400" EOFThe above command creates two Service Accounts:
serviceaccount/cloudwatch-agent created serviceaccount/fluent-bit created -
Now deploy Fluent Bit in your EKS Anywhere cluster to scrape and send logs to CloudWatch:
kubectl apply -f "https://anywhere.eks.amazonaws.com/manifests/fluentbit.yaml"You should see the following output:
clusterrole.rbac.authorization.k8s.io/cloudwatch-agent-role changed clusterrolebinding.rbac.authorization.k8s.io/cloudwatch-agent-role-binding changed configmap/cwagentconfig changed daemonset.apps/cloudwatch-agent changed configmap/fluent-bit-cluster-info changed clusterrole.rbac.authorization.k8s.io/fluent-bit-role changed clusterrolebinding.rbac.authorization.k8s.io/fluent-bit-role-binding changed configmap/fluent-bit-config changed daemonset.apps/fluent-bit changed -
You can verify the
DaemonSetshave been deployed with the following command:kubectl -n amazon-cloudwatch get daemonsets
-
If you are running the EKS connector , you can verify the status of
DaemonSetsby logging into AWS console and navigate to Amazon EKS -> Cluster -> Resources -> DaemonSets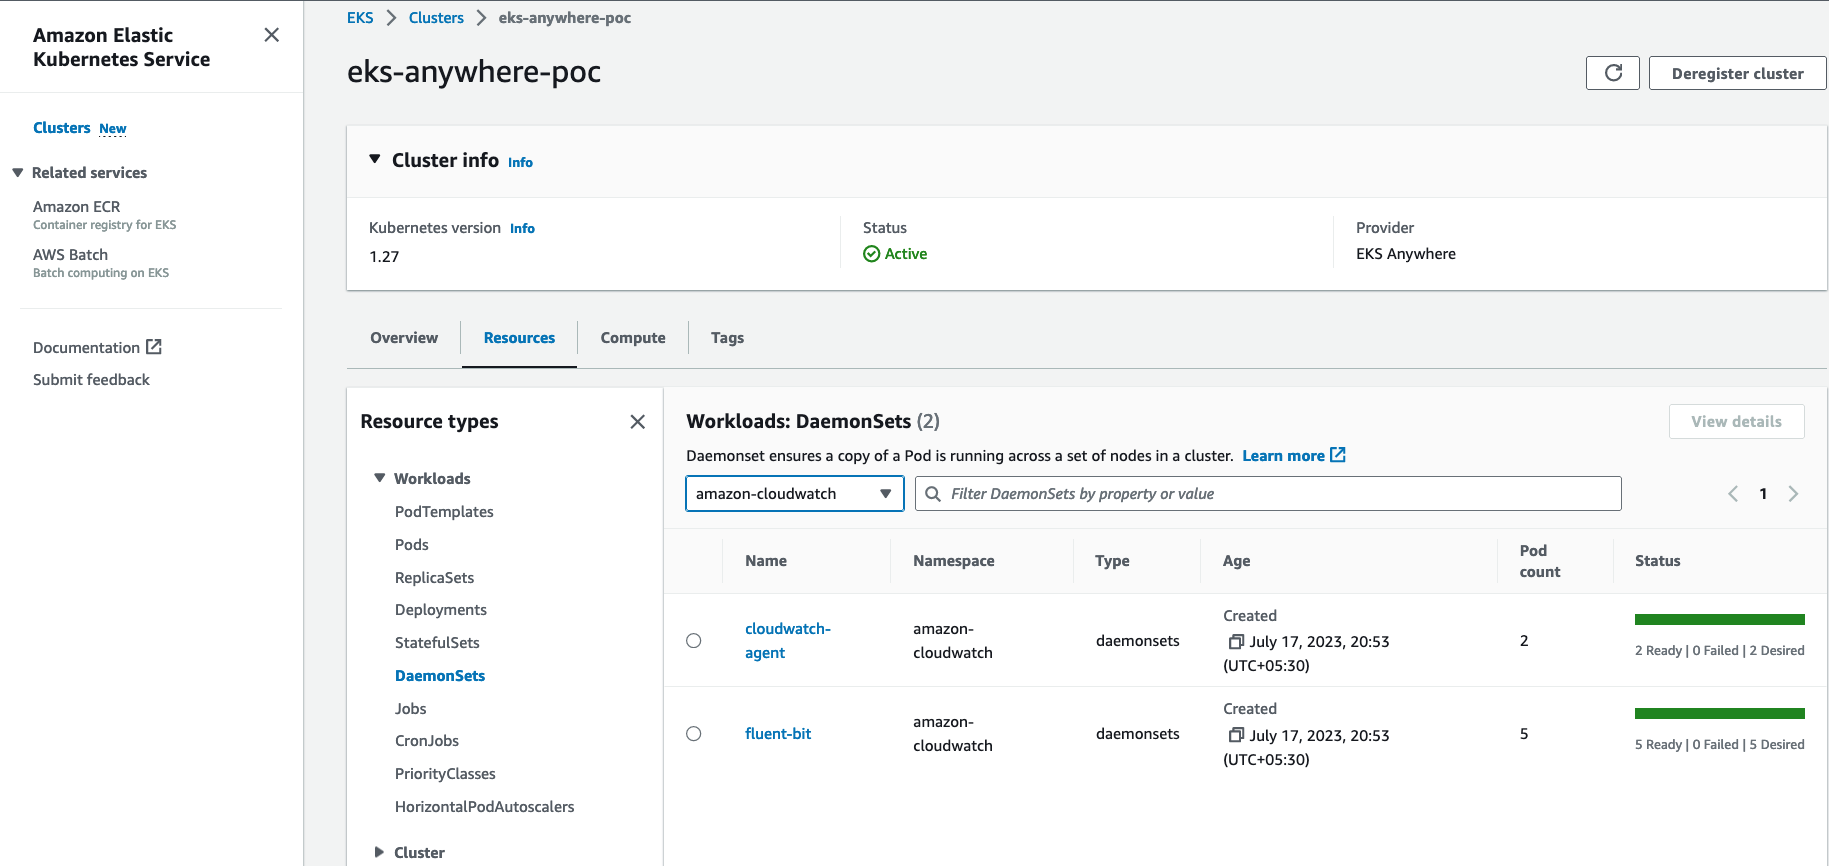
Step 4: Deploy a test application
Deploy a simple test application to verify your setup is working properly.
Step 5: View cluster logs and metrics
Cloudwatch Logs
-
Open the CloudWatch console . The link opens the console and displays your current available log groups.
-
Choose the EKS Anywhere clustername that you want to view logs for. The log group name format is /aws/containerinsights/
my-EKS-Anywhere-cluster/cluster.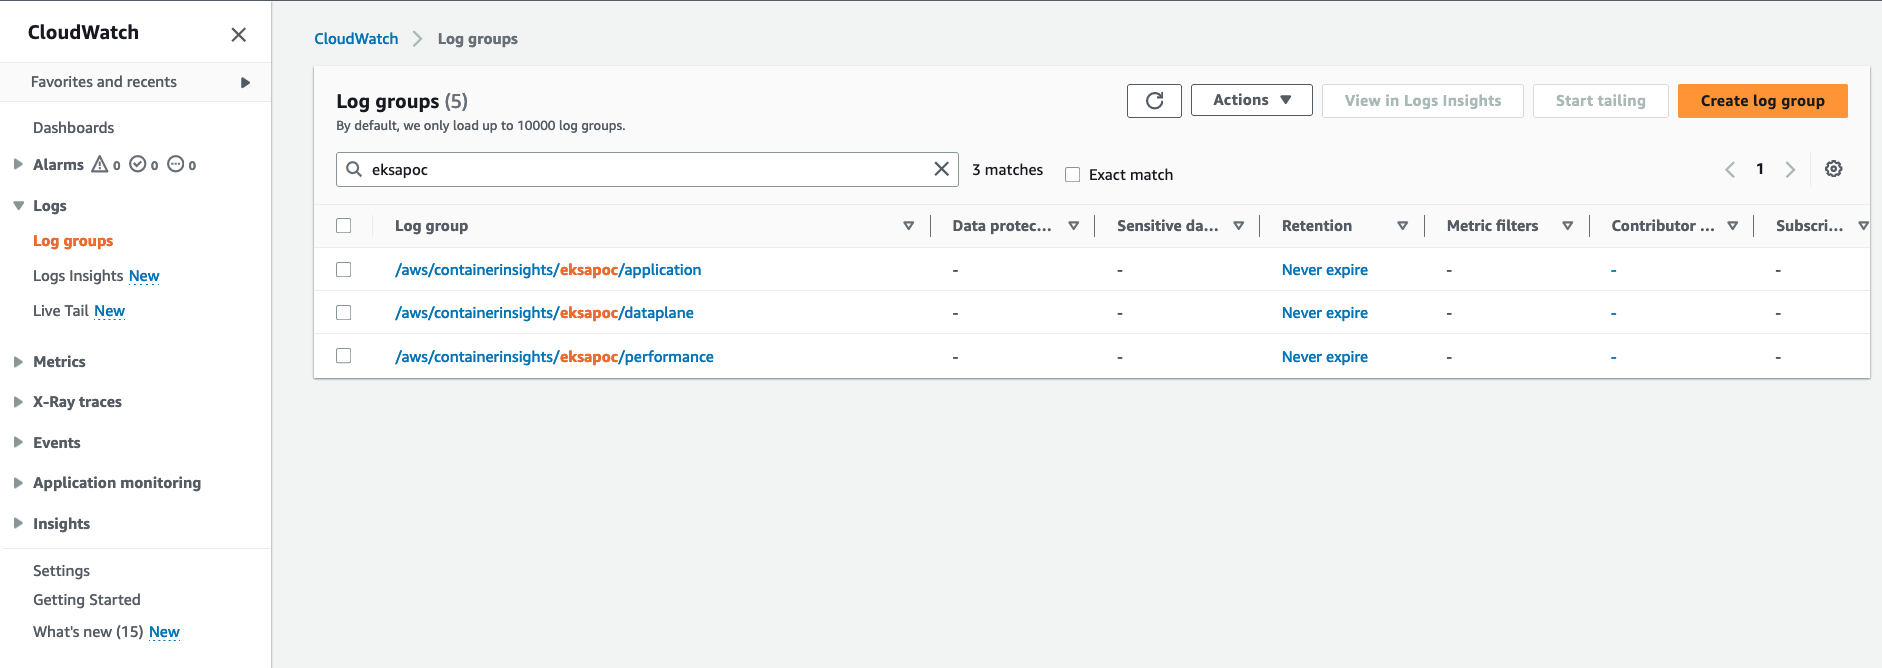
Log group name
/aws/containerinsights/my-EKS-Anywhere-cluster/applicationhas log source from /var/log/containers.Log group name
/aws/containerinsights/my-EKS-Anywhere-cluster/dataplanehas log source forkubelet.service,kubeproxy.service, anddocker.service -
To view the deployed test application logs, click on the application LogGroup, and click on Search All
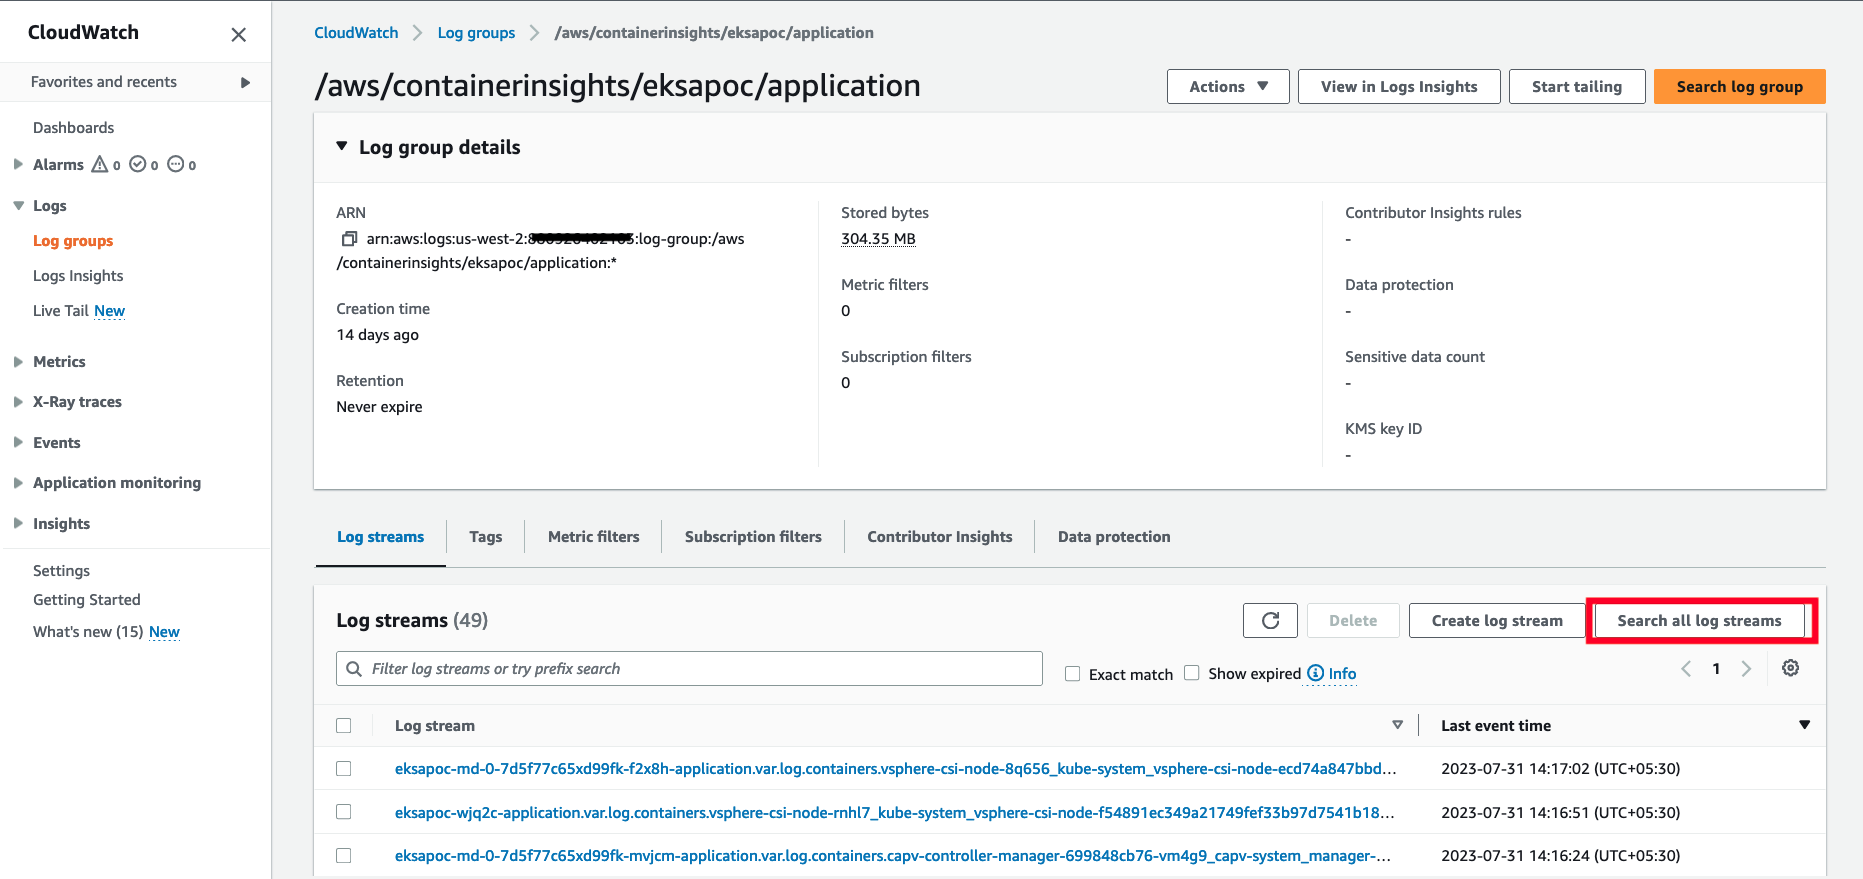
-
Type
HTTP 1.1 200in the search box and press enter. You should see logs as shown below: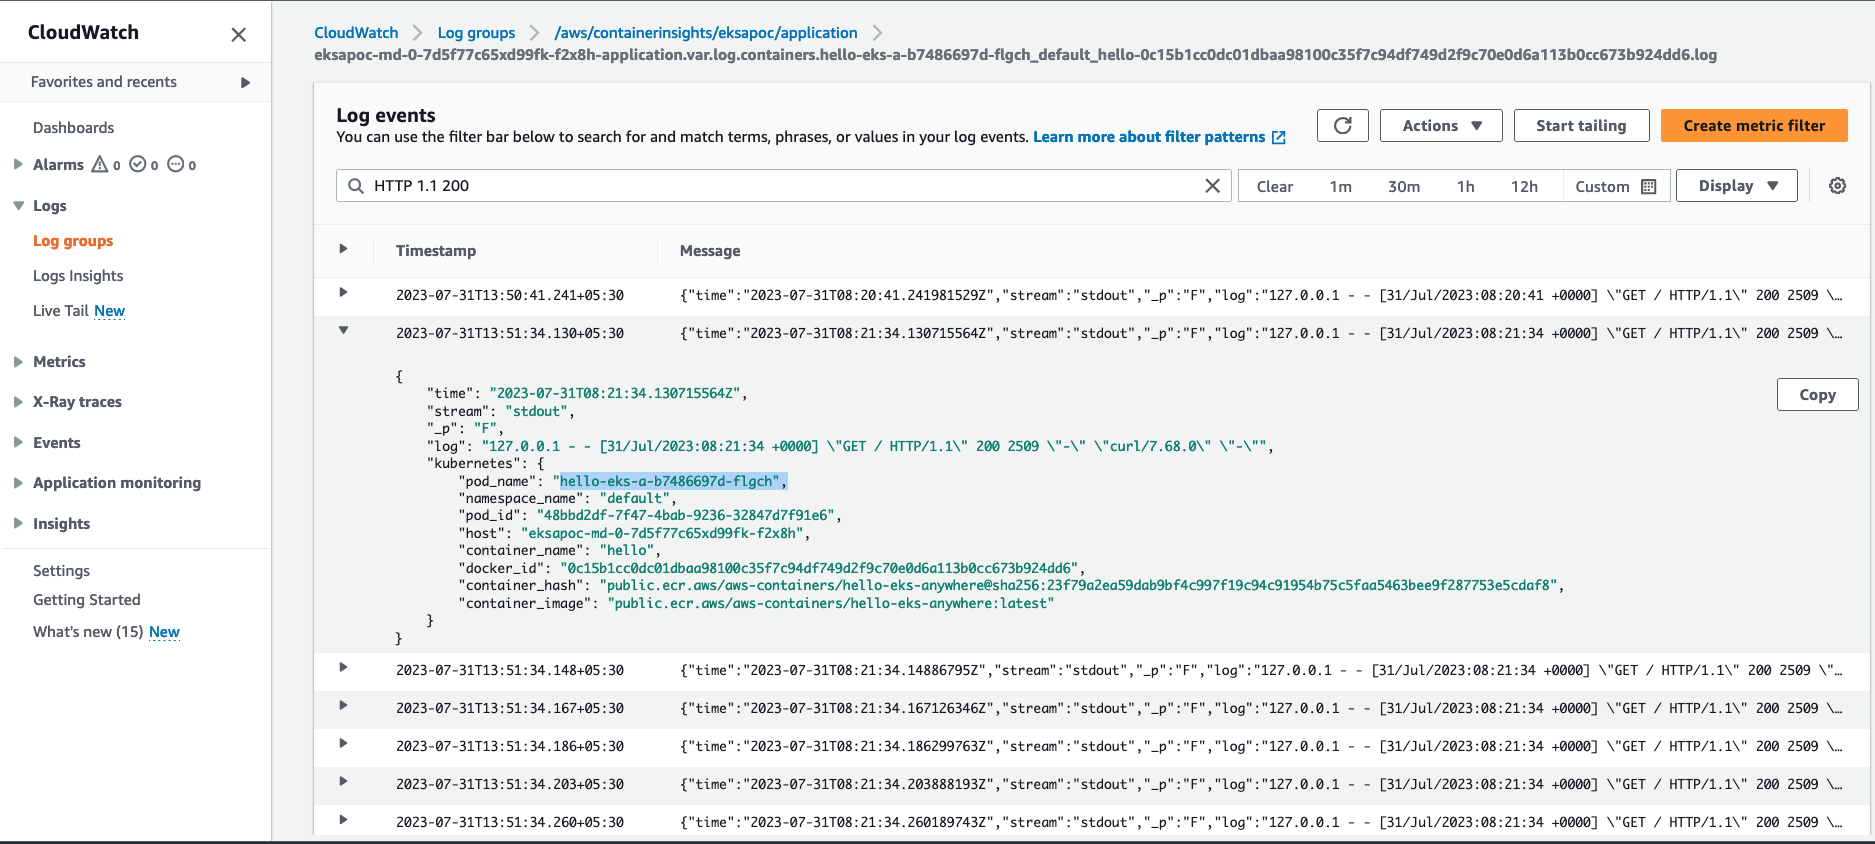
Cloudwatch Container Insights
-
Open the CloudWatch console . The link opens the Container Insights performance Monitoring console and displays a dropdown to select your
EKS Clusters.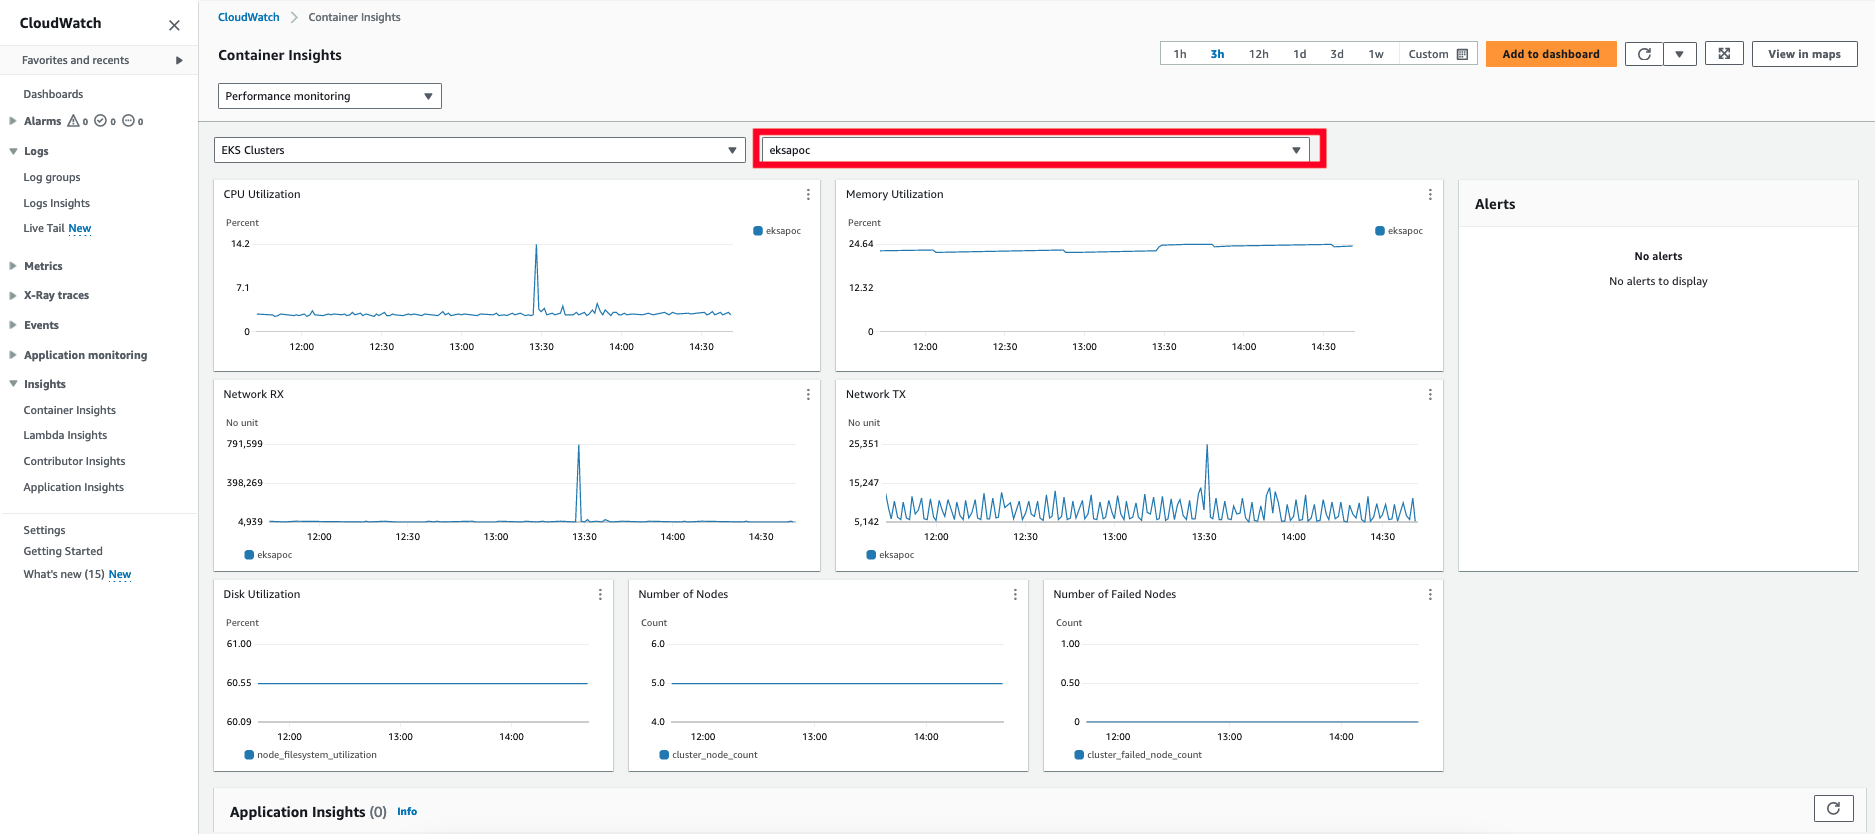
For more details on CloudWatch logs, please refer What is Amazon CloudWatch Logs?
5 - Expose metrics for EKS Anywhere components
Some Kubernetes system components like kube-controller-manager, kube-scheduler, kube-proxy and etcd (Stacked) expose metrics only on the localhost by default. In order to expose metrics for these components so that other monitoring systems like Prometheus can scrape them, you can deploy a proxy as a Daemonset on the host network of the nodes. The proxy pods also need to be configured with control plane tolerations so that they can be scheduled on the control plane nodes.
For etcd metrics, the steps outlined below are applicable only for stacked etcd setup. For Unstacked/External etcd, metrics are already exposed on https://<etcd-machine-ip>:2379/metrics endpoint and can be scraped by Prometheus directly without deploying a proxy.
Configure Proxy
To configure a proxy for exposing metrics on an EKS Anywhere cluster, you can perform the following steps:
-
Create a config map to store the proxy configuration.
Below is an example ConfigMap if you use HAProxy as the proxy server.
cat << EOF | kubectl apply -f - apiVersion: v1 kind: ConfigMap metadata: name: metrics-proxy data: haproxy.cfg: | defaults mode http timeout connect 5000ms timeout client 5000ms timeout server 5000ms default-server maxconn 10 frontend kube-proxy bind \${NODE_IP}:10249 http-request deny if !{ path /metrics } default_backend kube-proxy backend kube-proxy server kube-proxy 127.0.0.1:10249 check frontend kube-controller-manager bind \${NODE_IP}:10257 http-request deny if !{ path /metrics } default_backend kube-controller-manager backend kube-controller-manager server kube-controller-manager 127.0.0.1:10257 ssl verify none check frontend kube-scheduler bind \${NODE_IP}:10259 http-request deny if !{ path /metrics } default_backend kube-scheduler backend kube-scheduler server kube-scheduler 127.0.0.1:10259 ssl verify none check frontend etcd bind \${NODE_IP}:2381 http-request deny if !{ path /metrics } default_backend etcd backend etcd server etcd 127.0.0.1:2381 check EOF -
Create a daemonset for the proxy and mount the config map volume onto the proxy pods.
Below is an example configuration for the HAProxy daemonset.
cat << EOF | kubectl apply -f - apiVersion: apps/v1 kind: DaemonSet metadata: name: metrics-proxy spec: selector: matchLabels: app: metrics-proxy template: metadata: labels: app: metrics-proxy spec: tolerations: - key: node-role.kubernetes.io/control-plane operator: Exists effect: NoSchedule hostNetwork: true containers: - name: haproxy image: public.ecr.aws/eks-anywhere/kubernetes-sigs/kind/haproxy:v0.20.0-eks-a-54 env: - name: NODE_IP valueFrom: fieldRef: apiVersion: v1 fieldPath: status.hostIP ports: - name: kube-proxy containerPort: 10249 - name: kube-ctrl-mgr containerPort: 10257 - name: kube-scheduler containerPort: 10259 - name: etcd containerPort: 2381 volumeMounts: - mountPath: "/usr/local/etc/haproxy" name: haproxy-config volumes: - configMap: name: metrics-proxy name: haproxy-config EOF
Configure Client Permissions
-
Create a new cluster role for the client to access the metrics endpoint of the components.
cat << EOF | kubectl apply -f - apiVersion: rbac.authorization.k8s.io/v1 kind: ClusterRole metadata: name: metrics-reader rules: - nonResourceURLs: - "/metrics" verbs: - get EOF -
Create a new cluster role binding to bind the above cluster role to the client pod’s service account.
cat << EOF | kubectl apply -f - apiVersion: rbac.authorization.k8s.io/v1 kind: ClusterRoleBinding metadata: name: metrics-reader-binding subjects: - kind: ServiceAccount name: default namespace: default roleRef: kind: ClusterRole name: metrics-reader apiGroup: rbac.authorization.k8s.io EOF -
Verify that the metrics are exposed to the client pods by running the following commands:
cat << EOF | kubectl apply -f - apiVersion: v1 kind: Pod metadata: name: test-pod spec: tolerations: - key: node-role.kubernetes.io/control-plane operator: Exists effect: NoSchedule containers: - command: - /bin/sleep - infinity image: curlimages/curl:latest name: test-container env: - name: NODE_IP valueFrom: fieldRef: apiVersion: v1 fieldPath: status.hostIP EOFkubectl exec -it test-pod -- sh export TOKEN=$(cat /var/run/secrets/kubernetes.io/serviceaccount/token) curl -H "Authorization: Bearer ${TOKEN}" "http://${NODE_IP}:10257/metrics" curl -H "Authorization: Bearer ${TOKEN}" "http://${NODE_IP}:10259/metrics" curl -H "Authorization: Bearer ${TOKEN}" "http://${NODE_IP}:10249/metrics" curl -H "Authorization: Bearer ${TOKEN}" "http://${NODE_IP}:2381/metrics"