Note
Go to the end to download the full example code.
Barycenter of labeled graphs with FGW
This example illustrates the computation barycenter of labeled graphs using FGW [18].
Requires networkx >=2
[18] Vayer Titouan, Chapel Laetitia, Flamary Rémi, Tavenard Romain and Courty Nicolas “Optimal Transport for structured data with application on graphs” International Conference on Machine Learning (ICML). 2019.
# Author: Titouan Vayer <titouan.vayer@irisa.fr> # # License: MIT License import numpy as np import matplotlib.pyplot as plt import networkx as nx import math from scipy.sparse.csgraph import shortest_path import matplotlib.colors as mcol from matplotlib import cm from ot.gromov import fgw_barycenters def find_thresh(C, inf=0.5, sup=3, step=10): """Trick to find the adequate thresholds from where value of the C matrix are considered close enough to say that nodes are connected The threshold is found by a linesearch between values "inf" and "sup" with "step" thresholds tested. The optimal threshold is the one which minimizes the reconstruction error between the shortest_path matrix coming from the thresholded adjacency matrix and the original matrix. Parameters ---------- C : ndarray, shape (n_nodes,n_nodes) The structure matrix to threshold inf : float The beginning of the linesearch sup : float The end of the linesearch step : integer Number of thresholds tested """ dist = [] search = np.linspace(inf, sup, step) for thresh in search: Cprime = sp_to_adjacency(C, 0, thresh) SC = shortest_path(Cprime, method="D") SC[SC == float("inf")] = 100 dist.append(np.linalg.norm(SC - C)) return search[np.argmin(dist)], dist def sp_to_adjacency(C, threshinf=0.2, threshsup=1.8): """Thresholds the structure matrix in order to compute an adjacency matrix. All values between threshinf and threshsup are considered representing connected nodes and set to 1. Else are set to 0 Parameters ---------- C : ndarray, shape (n_nodes,n_nodes) The structure matrix to threshold threshinf : float The minimum value of distance from which the new value is set to 1 threshsup : float The maximum value of distance from which the new value is set to 1 Returns ------- C : ndarray, shape (n_nodes,n_nodes) The threshold matrix. Each element is in {0,1} """ H = np.zeros_like(C) np.fill_diagonal(H, np.diagonal(C)) C = C - H C = np.minimum(np.maximum(C, threshinf), threshsup) C[C == threshsup] = 0 C[C != 0] = 1 return C def build_noisy_circular_graph( N=20, mu=0, sigma=0.3, with_noise=False, structure_noise=False, p=None ): """Create a noisy circular graph""" g = nx.Graph() g.add_nodes_from(list(range(N))) for i in range(N): noise = np.random.normal(mu, sigma, 1)[0] if with_noise: g.add_node(i, attr_name=math.sin((2 * i * math.pi / N)) + noise) else: g.add_node(i, attr_name=math.sin(2 * i * math.pi / N)) g.add_edge(i, i + 1) if structure_noise: randomint = np.random.randint(0, p) if randomint == 0: if i <= N - 3: g.add_edge(i, i + 2) if i == N - 2: g.add_edge(i, 0) if i == N - 1: g.add_edge(i, 1) g.add_edge(N, 0) noise = np.random.normal(mu, sigma, 1)[0] if with_noise: g.add_node(N, attr_name=math.sin((2 * N * math.pi / N)) + noise) else: g.add_node(N, attr_name=math.sin(2 * N * math.pi / N)) return g def graph_colors(nx_graph, vmin=0, vmax=7): cnorm = mcol.Normalize(vmin=vmin, vmax=vmax) cpick = cm.ScalarMappable(norm=cnorm, cmap="viridis") cpick.set_array([]) val_map = {} for k, v in nx.get_node_attributes(nx_graph, "attr_name").items(): val_map[k] = cpick.to_rgba(v) colors = [] for node in nx_graph.nodes(): colors.append(val_map[node]) return colors Generate data
We build a dataset of noisy circular graphs. Noise is added on the structures by random connections and on the features by gaussian noise.
np.random.seed(30) X0 = [] for k in range(9): X0.append( build_noisy_circular_graph( np.random.randint(15, 25), with_noise=True, structure_noise=True, p=3 ) ) Plot data
plt.figure(figsize=(8, 10)) for i in range(len(X0)): plt.subplot(3, 3, i + 1) g = X0[i] pos = nx.kamada_kawai_layout(g) nx.draw_networkx( g, pos=pos, node_color=graph_colors(g, vmin=-1, vmax=1), with_labels=False, node_size=100, ) plt.suptitle("Dataset of noisy graphs. Color indicates the label", fontsize=20) plt.show() 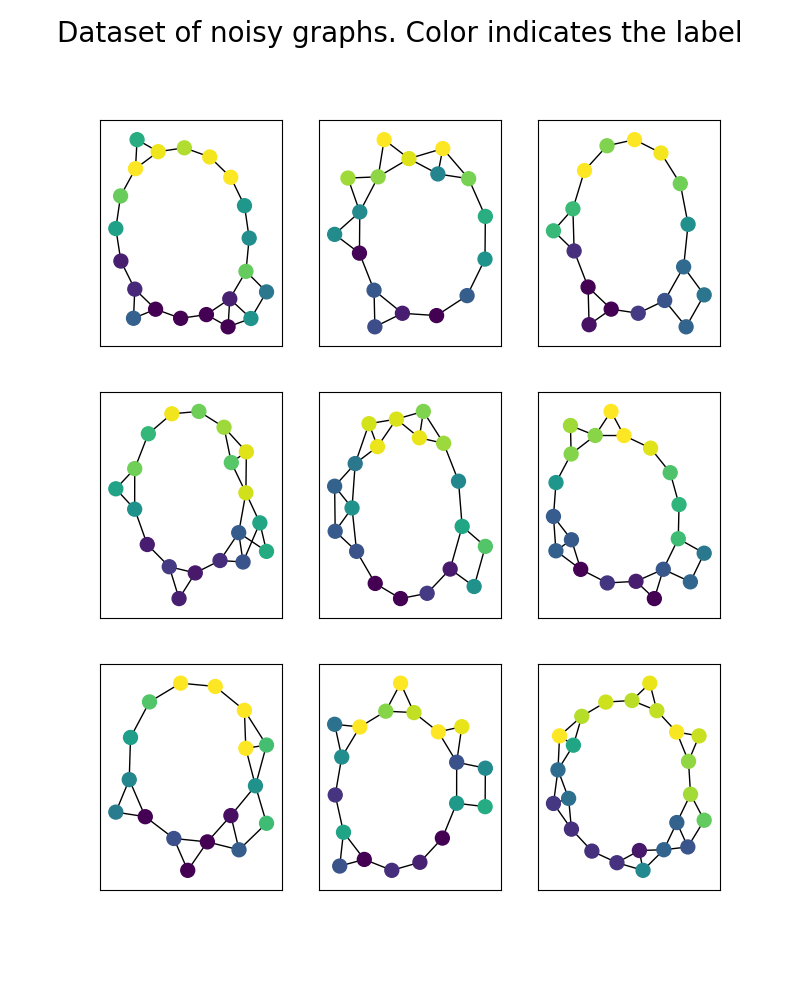
Barycenter computation
Features distances are the euclidean distances
Cs = [shortest_path(nx.adjacency_matrix(x).toarray()) for x in X0] ps = [np.ones(len(x.nodes())) / len(x.nodes()) for x in X0] Ys = [ np.array([v for (k, v) in nx.get_node_attributes(x, "attr_name").items()]).reshape( -1, 1 ) for x in X0 ] lambdas = np.array([np.ones(len(Ys)) / len(Ys)]).ravel() sizebary = 15 # we choose a barycenter with 15 nodes A, C, log = fgw_barycenters(sizebary, Ys, Cs, ps, lambdas, alpha=0.95, log=True) Plot Barycenter
pos = nx.kamada_kawai_layout(bary) nx.draw_networkx( bary, pos=pos, node_color=graph_colors(bary, vmin=-1, vmax=1), with_labels=False ) plt.suptitle("Barycenter", fontsize=20) plt.show() 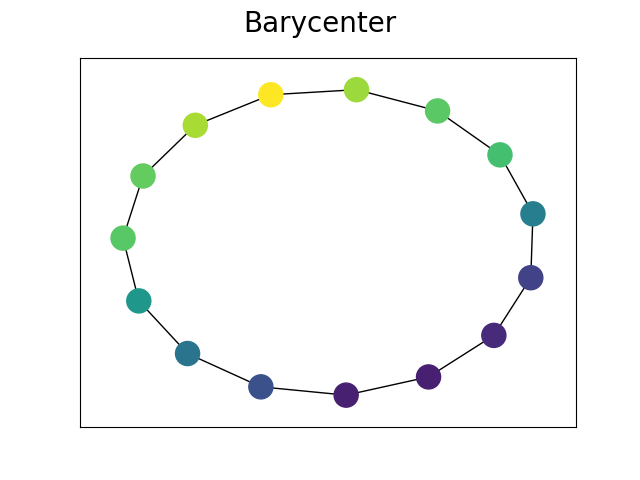
Total running time of the script: (0 minutes 1.615 seconds)