Expose Metrics
By plugging custom metrics onto your code, you will be able to monitor in-code values, in realtime.
Quick Start
First install tx2 module:
$ npm install tx2 Then create and app called monit.js:
const tx2 = require('tx2') const http = require('http') let meter = tx2.meter({ name : 'req/sec', samples : 1, timeframe : 60 }) http.createServer((req, res) => { meter.mark() res.writeHead(200, {'Content-Type': 'text/plain'}) res.write('Hello World!') res.end() }).listen(6001) And start it with PM2:
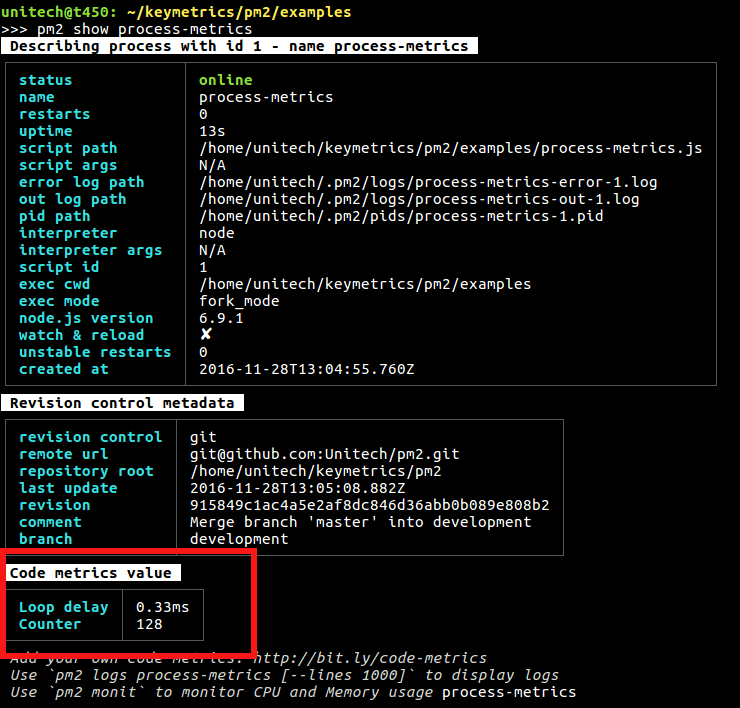
$ pm2 start monit.js Now show the metrics with the command:
$ pm2 show [app] # pm2 show monit Note: metrics are in the section “Custom Metrics”.

or you can use the Terminal based interface:
$ pm2 monit 
Metrics helper available
Then you can program your very own metrics to track important information. 4 different probes are available:
- Simple metrics: Values that can be read instantly
- eg. Monitor variable value
- Counter: Things that increment or decrement
- eg. Downloads being processed, user connected
- Meter: Things that are measured as events / interval
- eg. Request per minute for a http server
- Histogram: Keeps a reservoir of statistically relevant values biased towards the last 5 minutes to explore their distribution
- eg. Monitor the mean of execution of a query into database
API Documentation
Note: Refer to the TX2 API Documentation
Examples
Simple Metric: Simple value reporting
This allows to expose values that can be read instantly.
const tx2 = require('tx2') // Here the value function will be called each second to get the value var metric = tx2.metric({ name : 'Realtime user', value : function() { return Object.keys(users).length } }) // Here we are going to call valvar.set() to set the new value var valvar = tx2.metric({ name : 'Realtime Value' }) valvar.set(23) Counter: Sequential value change
Values that increment or decrement.
Example to count Active Http Requests:
const tx2 = require('tx2') var http = require('http') var counter = tx2.counter({ name : 'Active requests' }) http.createServer(function (req, res) { counter.inc() req.on('end', function() { // Decrement the counter, counter will eq 0 counter.dec() }) res.writeHead(200, {'Content-Type': 'text/plain'}) res.write('Hello World!') res.end() }).listen(6001) Meter: Average calculated values
Values that are measured as events / interval.
Example to count number of queries per second:
const tx2 = require('tx2') var http = require('http') var meter = tx2.meter({ name : 'req/sec', samples : 1, timeframe : 60 }) http.createServer(function (req, res) { meter.mark() res.writeHead(200, {'Content-Type': 'text/plain'}) res.write('Hello World!') res.end() }).listen(6001) Options
samples option is the rate unit. Defaults to 1 sec. timeframe option is the timeframe over which events will be analyzed. Defaults to 60 sec.
Histogram
Keeps a reservoir of statistically relevant values biased towards the last 5 minutes to explore their distribution.
const tx2 = require('tx2') var histogram = tx2.histogram({ name : 'latency', measurement : 'mean' }) var latency = 0 setInterval(function() { latency = Math.round(Math.random() * 100) histogram.update(latency) }, 100)