Anomaly Detection with Arima Model using Python
In this Machine Learning Project, we will develop anomaly detection using Arima Model. For this project, we have a finance dataset in which there is a label for every transaction if it is fraud or not. For this project, we are using the Arima Model for anomaly detection.
So, let’s build an anomaly detection system.
Anomaly Detection
The tremendous volume of data that is transmitted every day as a result of the widespread use of the Internet. The network environment is experiencing an increase in malicious activity on a daily basis. Network assaults can result in damage ranging from minor service interruptions to massive loss.
An effective intrusion detector needs to be created in order to keep track of malicious activity. Network traffic can be monitored to look for known attacks using misuse or signature detection techniques used in intrusion detection. To deal with unidentified attacks, an anomaly detection technique can be utilized to identify variation from typical usage patterns as an incursion.
It is preferable to deal with unknown hostile actions through automated detection. Machine Learning is highly suited for Automated Detection. A network anomaly is a sudden, transient departure from the network’s usual behaviour.
Algorithms that use machine learning can learn from data and create predictions using that data. The process of finding objects or occurrences that don’t fit the expected pattern or the other items included in a dataset is known as anomaly detection.
Anomalies can occur accidentally or maliciously. Some anomalies are generated on purpose by intrusions. When an intruder is detected by a surveillance network, quick detection is necessary to start a fast response, such as sounding the alarm. Devices for network monitoring gather data quickly.
Finding the patterns in data that deviate from expected behavior is referred to as the anomaly detection challenge. The terms anomalies, outliers, discordant observations, exceptions, aberrations, surprises, oddities, or contaminants, are frequently used to describe the non-conforming patterns in many application domains. In the domain of anomaly identification, anomalies and outliers are two terms that are frequently and occasionally used interchangeably.
Anomaly detection is widely used in a range of applications, including credit card fraud detection, insurance fraud detection, healthcare fraud detection, cyber security intrusion detection, fault detection in safety-critical systems, and military monitoring of enemy activity.
Anomalies in data can be translated into substantial (and frequently crucial) actionable information in a wide range of application fields, which highlights the significance of anomaly identification. For instance, an unusual pattern of traffic in a computer network may indicate that a compromised computer is transmitting private information to an unauthorized location. Anomalies in credit card transaction data could be a symptom of identity or credit card theft, while anomalous sensor readings from a spacecraft could signal a problem with one of the spacecraft’s components.
In the statistics community, outlier or anomaly detection has been studied since the 19th century. Different anomaly detection methods have evolved throughout time in various research communities. While some of these approaches are more general, a lot of them have been created expressly for particular application fields. An organized and thorough summary of the research on anomaly detection is attempted in this project.
We are going to use ARIMA model for this project.
Arima Model
The ARIMA model was introduced by Box and Jenkins in 1970. It is also known as the Box-Jenkins methodology, which consists of a series of steps for locating, calculating, and analyzing ARIMA models using time series data. This is the most popular technique for financial forecasting. Short-term forecasts can be produced with efficiency using ARIMA models. In terms of short-term prediction, it consistently beats complicated structural models. The future value of a variable in the ARIMA model is a linear combination of previous values and past mistakes, written as follows:
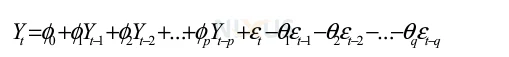
where p and q are integers that are sometimes referred to as the autoregressive and moving average, respectively, Y is the actual value and t is the random error. I and j are also the coefficients in this equation.
The best ARMA weights are often determined using the maximum likelihood (ML) and prediction error (PE) methods using a non-convex error criterion function. Other algorithms are also employed to tackle this problem, but they all have disadvantages. For instance, they could be unable to deliver the world’s ideal. Since the moving average model’s parameters are nonlinear, it is not possible to utilise traditional online algorithms with convex optimization techniques in this situation. Nonlinear estimating techniques must be used in order to estimate the parameters. Each time the model weights (a, b) are updated and every time the prediction process is repeated, noise components are necessary.
We were thinking about choosing the dataset for this project. The dataset for this project would be a bank credit card fraud excel sheet. The four components of the data are old balanced, new balanced, old balanced dest, and new balanced dest. Every transaction is marked as fraud and not fraud.
Project Prerequisites
The requirement for this project is Python 3.6 installed on your computer. I have used a Jupyter notebook for this project. You can use whatever you want.
The required modules for this project are –
- Numpy(1.22.4) – pip install numpy
- Pandas(1.5.0) – pip install pandas
- Seaborn(0.9.0) – pip install seaborn
- SkLearn(1.1.1) – pip install sklearn
- PmdArima(2.0.1) – pip install pmdarima
That’s all we need for our project.
Anomaly Detection Project & DataSet
We provide the dataset and source code that will be required in anomaly detection machine learning project. We will require a csv file for this project. You can download the dataset and the jupyter notebook from the link below.
Download the dataset and the jupyter notebook from the following link: Anomaly Detection Machine Learning Project
Steps to Implement the Project
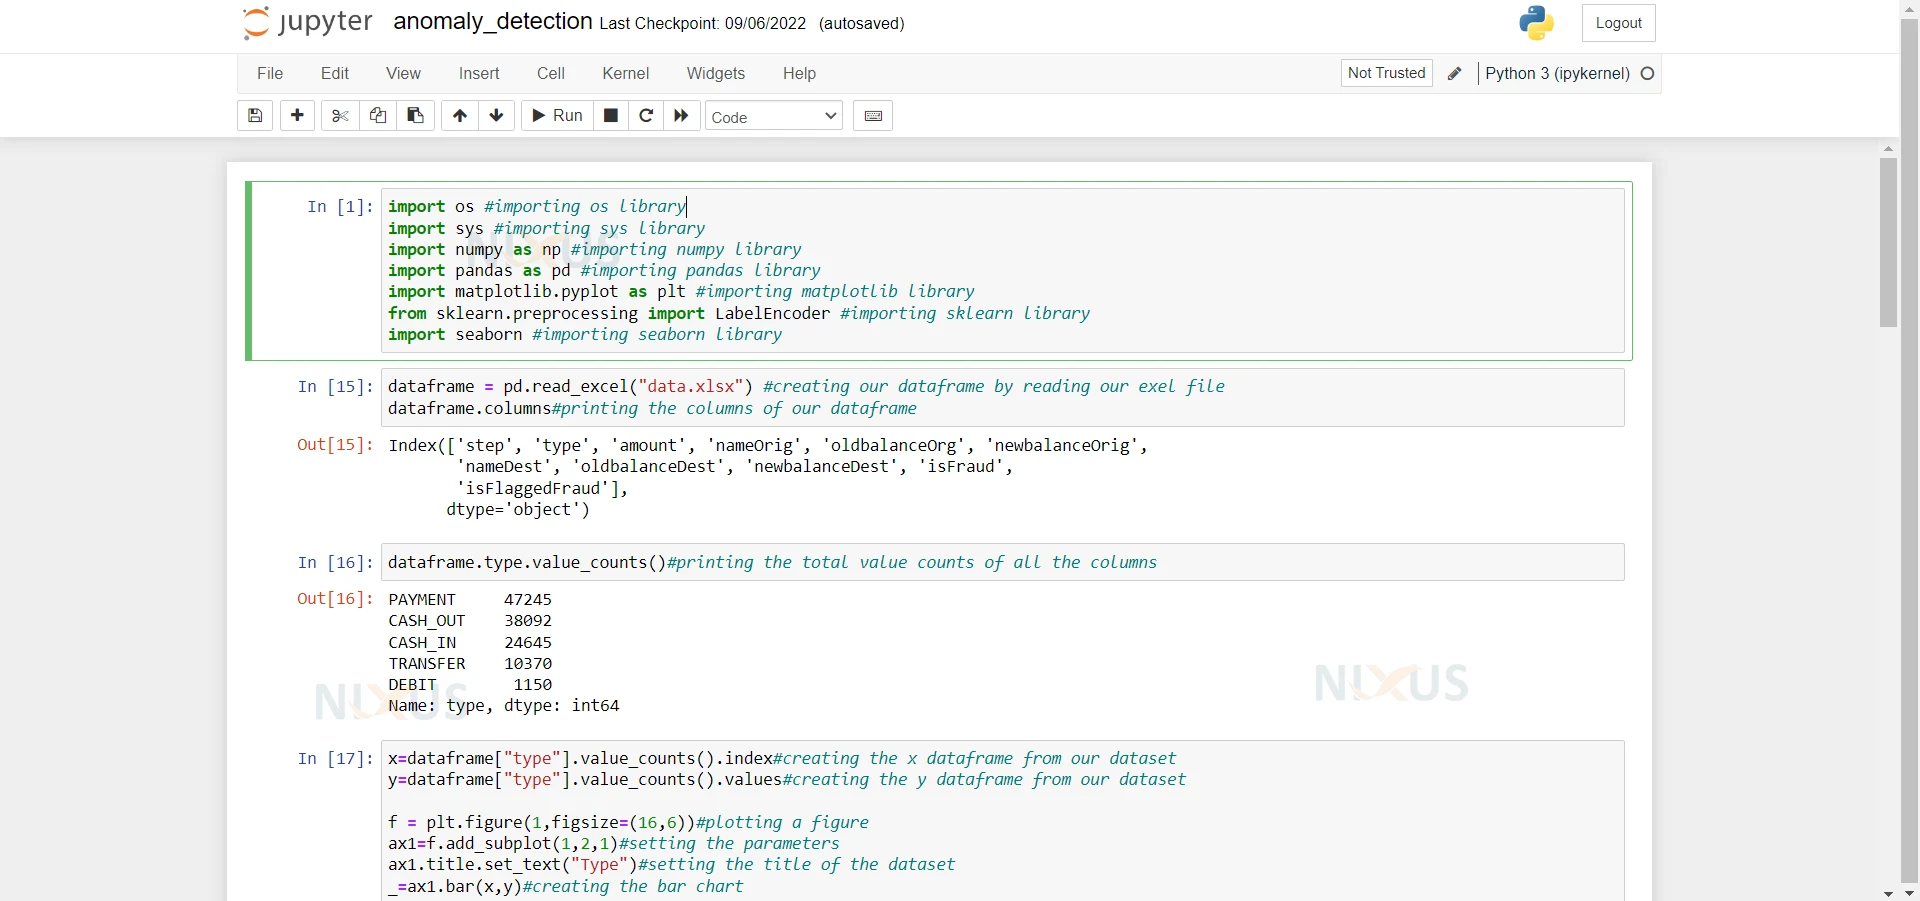
1. Import the modules and the libraries. For this project, we require numpy, pandas, seaborn for plotting the graphs, and finally sklearn. But the most important library is pmdarima which contains the arima model.
import os #importing os library import sys #importing sys library import numpy as np #importing numpy library import pandas as pd #importing pandas library import matplotlib.pyplot as plt #importing matplotlib library from sklearn.preprocessing import LabelEncoder #importing sklearn library import seaborn #importing seaborn library
2. Here we are reading our dataset. And we are printing the columns of our dataset.
dataframe = pd.read_excel("data.xlsx") #creating our dataframe by reading our exel file dataframe.columns#printing the columns of our dataframe 3. Here we are printing the value count of the all the columns.
dataframe.type.value_counts()#printing the total value counts of all the columns
4. Here we are creating the x and y dataframe. Also we are plotting the graphs of Amount column and Type column.
x=dataframe["type"].value_counts().index#creating the x dataframe from our dataset y=dataframe["type"].value_counts().values#creating the y dataframe from our dataset f = plt.figure(1,figsize=(16,6))#plotting a figure ax1=f.add_subplot(1,2,1)#setting the parameters ax1.title.set_text("Type")#setting the title of the dataset _=ax1.bar(x,y)#creating the bar chart z=dataframe["amount"].value_counts().index#creating the z dataframe from our dataset ax2 = f.add_subplot(1,2,2)#setting the parameters ax2.title.set_text("Amount")#setting the title of the dataset _=ax2.boxplot(z)#creating the bar chart 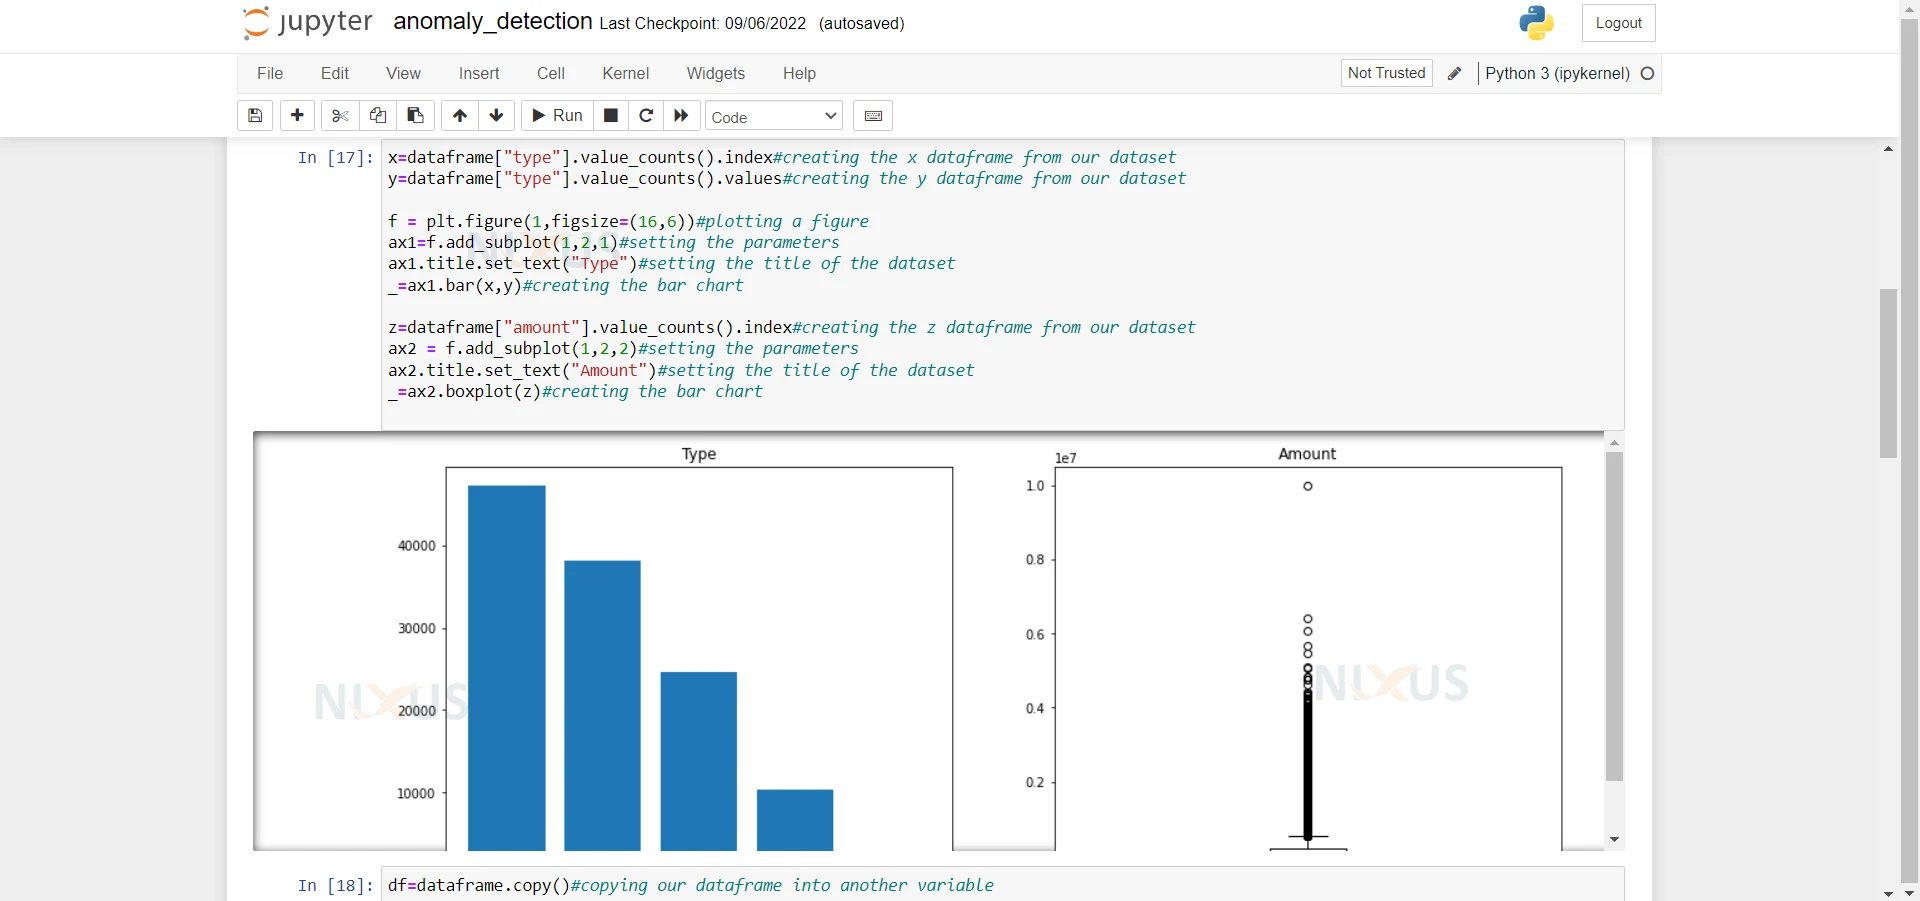
5. Here we are copying our data frame into another variable.
df=dataframe.copy()#copying our dataframe into another variable
6. Here we are using the label encode to fill the null values into our dataframe if the column is an ‘Object’ type otherwise we are filling it with -999 representing -inf.
for col in df.columns: #here we are using the label encoder to fill the null values if df[col].dtype=="object": #checking if the column is 'Object' label_encoder = LabelEncoder() #creating a Label Encoder df[col].fillna("None",inplace=True) #filling null values with None label_encoder.fit(list(df[col].astype(str).values))#fiiting our dataset into the label encoder df[col]=label_encoder.transform(list(df[col].astype(str).values)) else: df[col].fillna(-999,inplace=True) #else we are filling our column with -999 7. Here we are printing the rows of our dataframe.
df.head(2)#printing our dataset again
8. Here we are importing the arima model from pmdarima and also we are installing the statsmodel library.
from pmdarima import auto_arima #importing our arima model from pmdarima !pip install statsmodels #installing the statsmodel library
9. Here we are creating a function named isStationary which takes the data and checks if our data frame is stationary or not. Because it is really important for our model to be stationary. Fortunately, our model is stationary.
def isStationary(data, column='', maxval=0.05, series=False): #defining a function to check if our column is stationary or not if series: #if series test = statsmodels.tsa.stattools.adfuller(data, autolag='AIC') else: test = statsmodels.tsa.stattools.adfuller(data, autolag='AIC') p = test[1] if p <= maxval: test = "It is Stationary" #if p <= maxval then column is stationary else: test = "It is Non-Stationary"#else then column is not stationary return test #here we are returning our result isStationary(df, 'newbalanceOrig') #passing the dataframe into our function
10. Here we are passing the data to our model and then we are printing the summary of it.
arima = auto_arima(df['newbalanceOrig'], trace = True) arima.summary()
11. Here we are copying our data frame into a new variable.
processed_data = df #assigning our dataframe to preprocessed data
12. Here we are using the SARIMAX model and passing our dataset to it. We are defining some parameters to it.
model_sarimax = statsmodels.api.tsa.statespace.SARIMAX(df['newbalanceOrig'], order=(1, 1, 1), seasonal_order=(1, 1, 1, 12), enforce_stationarity=False, enforce_invertibility=False)#passing the parameters to our model SARIMAX prediction = model_sarimax.fit() #fitting the model print(prediction.summary().tables[1])#print our final result

Summary
In this Machine Learning project, we develop anomaly detection in the finance field. For this project, we are using the ARIMA model. We hope you have learned something new in this project.