


Mean Average Precision (mAP) is a performance metric used for evaluating machine learning models. It is the most popular metric that is used by benchmark challenges such as PASCAL VOC, COCO, ImageNET challenge, Google Open Image Challenge, etc. Mean Average Precision has different meanings on various platforms. Hence, oftentimes it can be confusing. Continue reading the article for a thorough explanation of mAP.
Mean Average Precision (mAP) in Object Detection [TL;DR]
In this blog post, we will discuss various performance metrics, datasets, benchmark challenges, and eventually focus on Mean Average Precision. To arrive at mAP, we will go through the following.
- Building blocks of Mean Average Precision. The model evaluation helper metrics – IoU, Confusion Matrix, Precision, and Recall.
- Calculate class-specific Precision and Recall.
- Plot Precision-Recall curve.
- Calculate Average Precision (AP) using the PASCAL VOC 11-point interpolation method.
- Calculate the Average Precision for all the classes.
- Find Mean Average Precision (mAP) by averaging APs.
You will learn how mAP evolved over time from PASCAL VOC to MS COCO. Finally, we will also walk through a bit of the history of some important datasets and their significance.
1. Model Evaluation Helper Metrics
Before discussing Mean Average Precision (mAP) it is important to understand the following metrics. There are many metrics to evaluate machine learning models. Each metric has its advantages and tradeoffs. In our case, we will be focusing only on the metrics that are the building blocks of Mean Average Precision (mAP).
1. Intersection Over Union
Intersection over Union (IoU) is a metric that quantifies the degree of overlap between two regions. We have already discussed IoU meaning in-depth in our previous article Intersection over Union in Object Detection and Segmentation. Check out the article to know more about how IoU metric is designed and implemented.
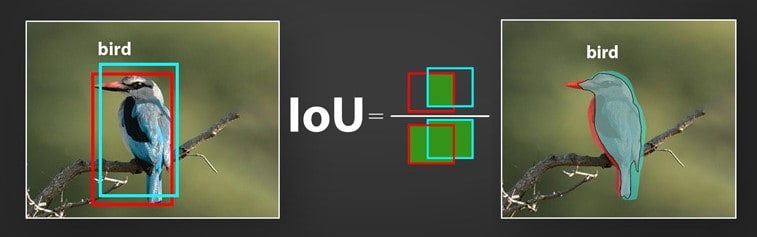
As mentioned above, IoU metric evaluates the correctness of a prediction. The value ranges from 0 to 1. With the help of IoU threshold value, we can decide whether a prediction is True Positive, False Positive, or False Negative. Confused with the terms? Interestingly, these terms collectively form the Confusion Matrix.


2. Confusion Matrix
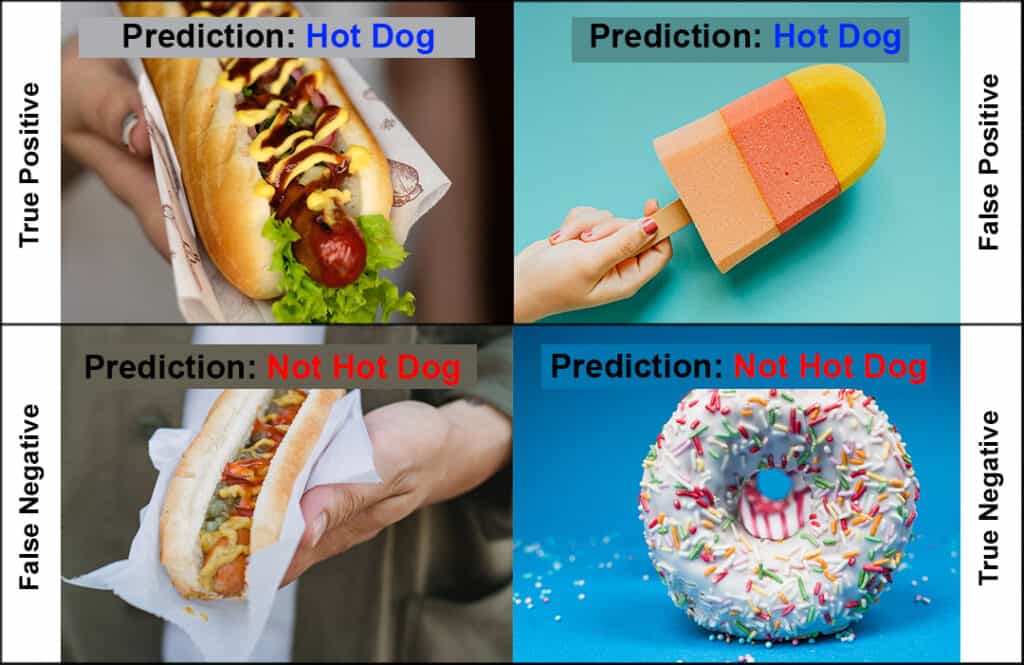
To understand the Confusion Matrix, let’s take an example of a classification problem. A model has to identify whether there are hot dogs in the image. The predictions can be either correct or incorrect. The following combination of predictions is possible based on the output and the actual image.
Similarly, these terms apply to object detection and segmentation as well. However, the exact meanings are not the same. In object detection, the correctness of the prediction (TP, FP, or FN) is decided with the help of the IoU threshold. Whereas in image segmentation, it is decided by referencing the Ground Truth pixels. Ground truth means known objects.
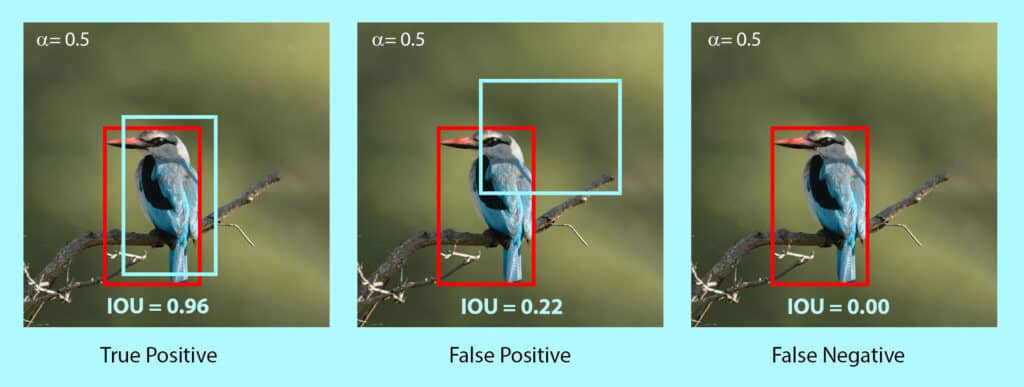
Fig: Object detection predictions based on IoU
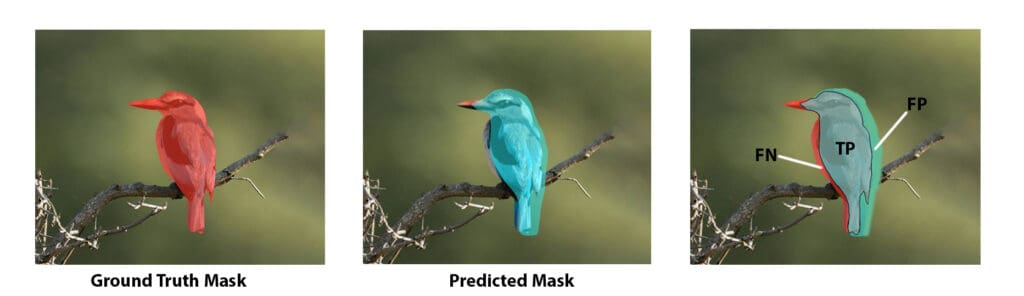
Fig: Image segmentation predictions based on Ground Truth Mask
Note that True Negative is not applicable to object detection and segmentation. It is correctly detecting the background of an object as background. Which is equivalent to not detecting anything.
3. Precision
Precision measures the proportion of predicted positives that are actually correct. If you are wondering how to calculate precision, it is simply the True Positives out of total detections. Mathematically, it’s defined as follows.
P = TP/(TP + FP)
= TP / Total Predictions
The value ranges from 0 to 1.
4. Recall
Recall measures the proportion of actual positives that were predicted correctly. It is the True Positives out of all Ground Truths. Mathematically, it is defined as follows.
R = TP / (TP + FN)
= TP / Total Ground Truths
Similar to Precision, the value of Recall also ranges from 0 to 1.
2. What is Average Precision(AP)?
Interestingly, Average Precision (AP) is not the average of Precision (P). The term AP has evolved with time. For simplicity, we can say that it is the area under the precision-recall curve. Here, we will go through a simple object detection example and learn how to calculate Average Precision (AP) manually. We will use the same YOLOv5 Nano model that we have used previously in the blog post, Object Detection using YOLOv5 and OpenCV DNN in C++ and Python.
How to calculate Average Precision (AP) manually?
Let us consider the following image that has various classes. The YOLOv5 nano model is predicting bounding boxes on the objects. The IoU threshold is set at 0.5. The ground truths are already known.

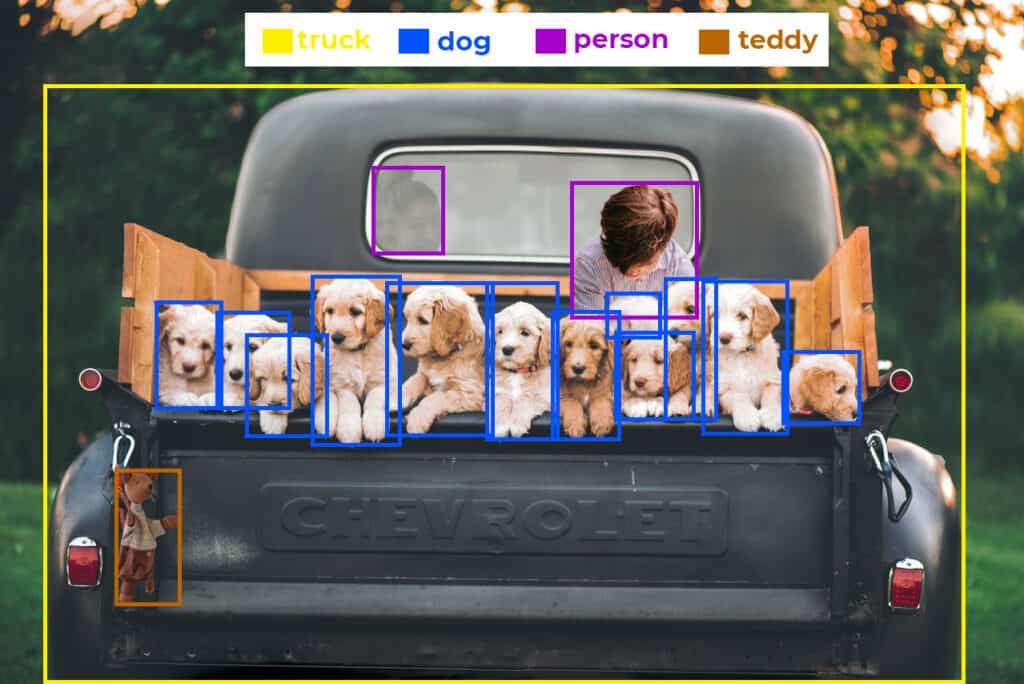
Fig: Ground truths
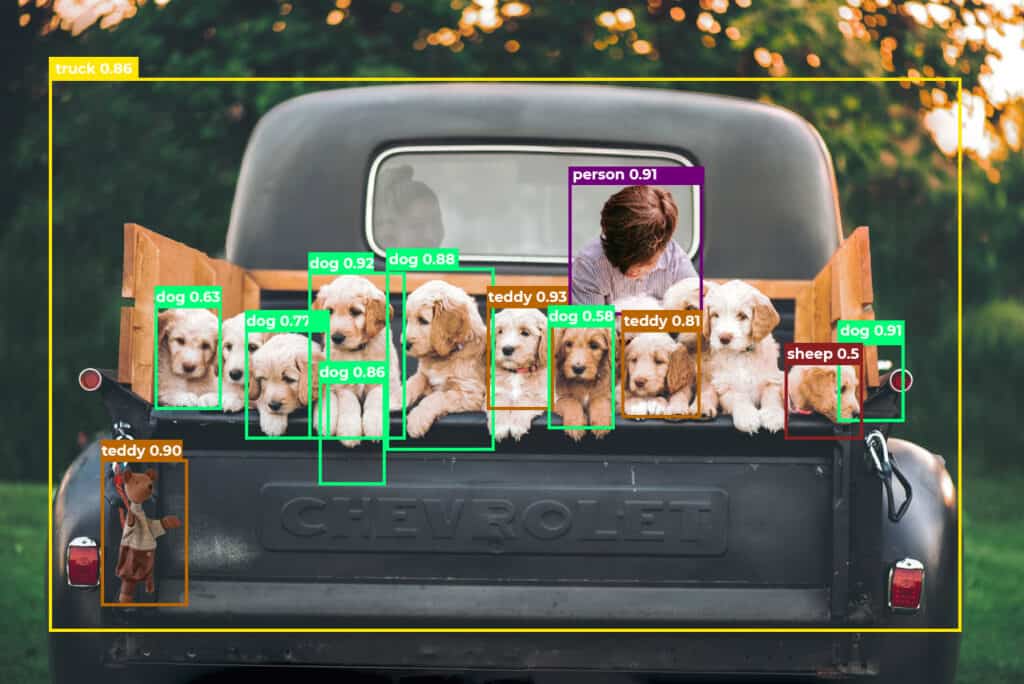
Fig: Predictions by YOLOv5 Nano
We can see that the images have the following objects (Ground Truths).
- 2 person
- 12 dog
- 1 teddy
- 1 truck
The YOLOv5 nano model has predicted the following objects.

Average Precision (AP) is calculated class-wise. We will discuss the reason a bit later. Now, let’s get started with calculating the AP of dog class. The steps to be followed are as follows.
2.1 Record every Dog detection along with the Confidence score
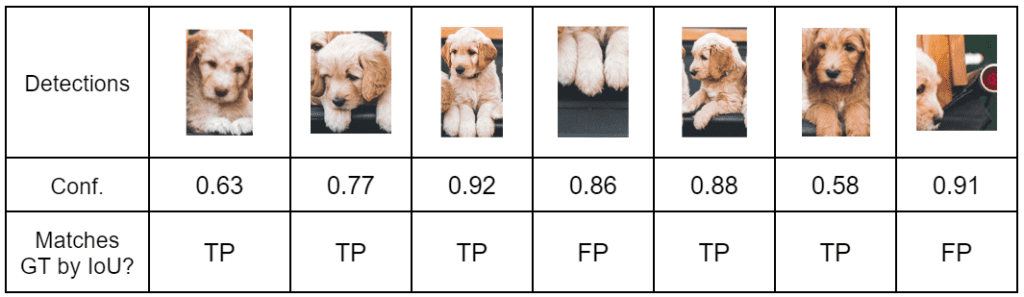
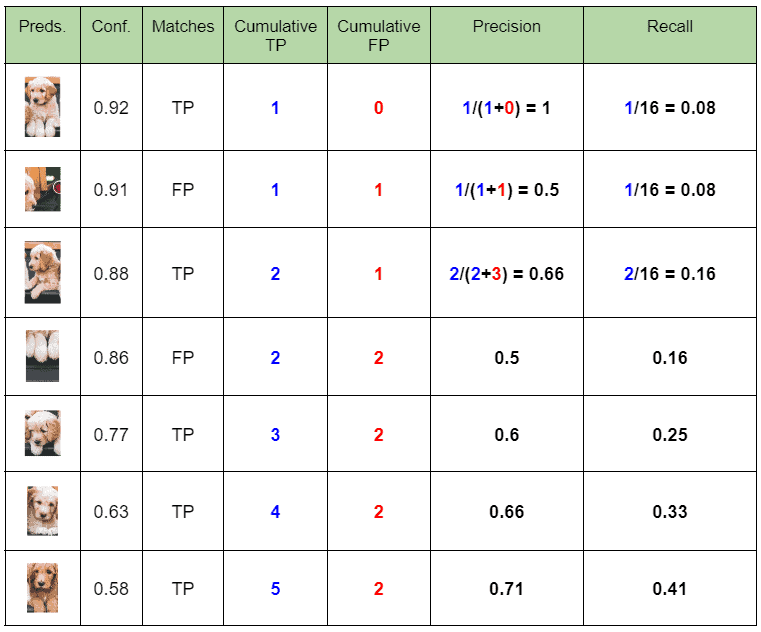
2.2 Calculate Precision and Recall
Here, we calculate detection-wise Precision and Recall values. Follow the steps below to tabulate the data.
- Sort the table in descending order of confidence.
- Tabulate cumulative TP and FP (Keep on adding the current value with the previous row).
- Calculate row-wise Precision and Recall.
Where,
P = Cumulative TP / ( Cumulative TP + Cumulative FP )
R = Cumulative TP / Total Ground Truths
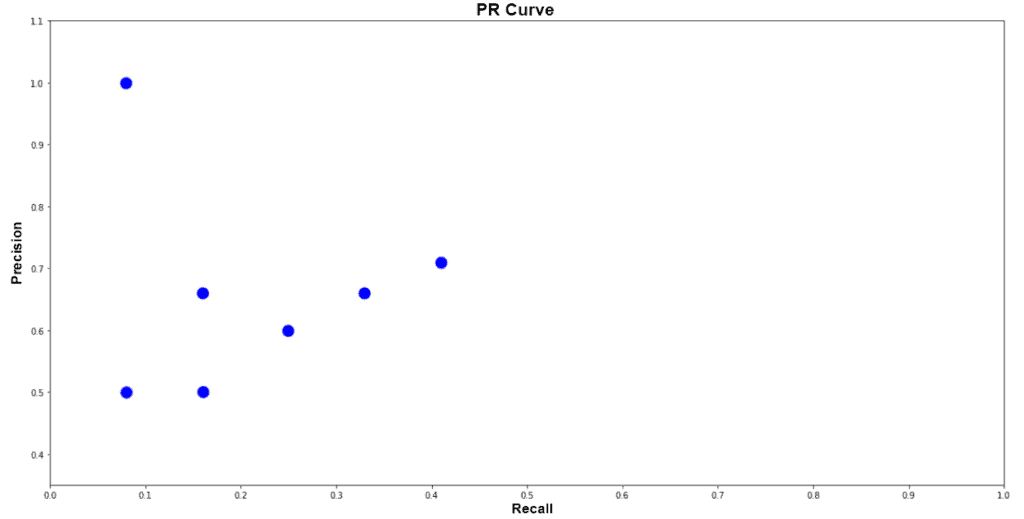
2.3 Plot Precision-Recall graph
Note: If the table contains multiple precision values for the same recall values, you can consider the highest value and discard the rest. Not doing so will NOT affect the final result. This is for simplifying the plot. In our case, we are plotting everything.
2.4 Calculate Average Precision (AP) using PASCAL VOC 11 Point Interpolation Method
The 11 point interpolation method was introduced in the 2007 PASCAL VOC challenge. Where Precision values are recorded across 11 equally spaced Recall values. Average Precision is defined as follows.
AP = 1/11 * Sum(11 point interpolated precision)
Precision values are interpolated across 11 Recall values, i.e., 0, 0.1, 0.2, 0.3,…,1.0. The interpolated Precision is the maximum Precision corresponding to the Recall value greater than the current Recall value. In simple terms, it is the maximum precision value to the right.
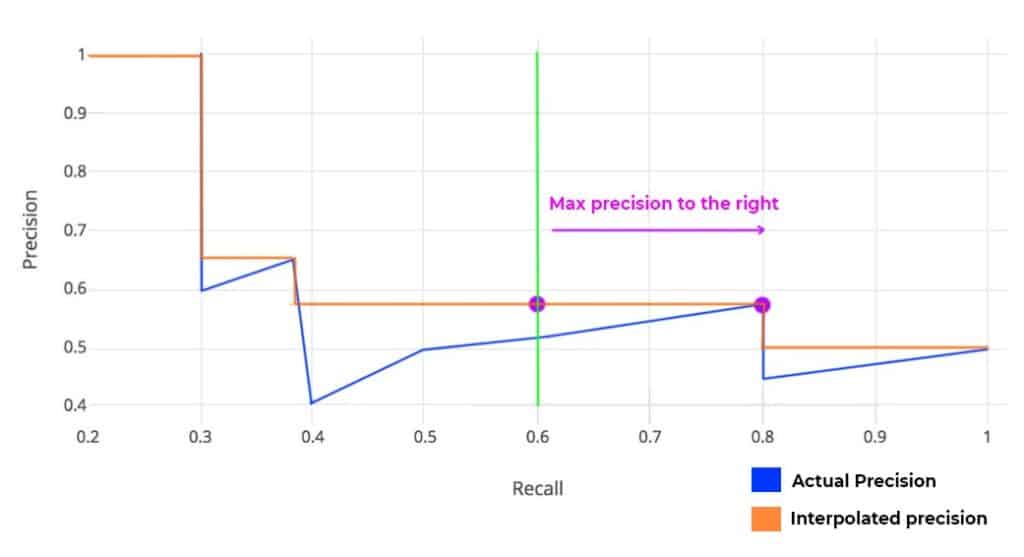
Fig: Example plot showing how to interpolate Precision values
Why Precision is interpolated only for 11 Recall points?
Quoting from the paper, The intention in interpolating the precision/recall curve in this way is to reduce the impact of the “wiggles” in the precision/recall curve, caused by small variations in the ranking of examples.
In reality, the evaluation dataset is huge. When we plot the graph for all predictions, the difference between adjacent points will be very very less. Hence, 11 point interpolation is sufficient to compare two models.
Is Average Precision (AP) calculated for all points as well?
Yes, it is calculated for all points. In fact, that is another evaluation metric adopted by VOC in 2010. We will discuss it in a bit. For now, let’s continue with the 11 point interpolation method and plot the graph.
2.5 Plot Final Interpolated graph and calculate Average Precision for Dog Class
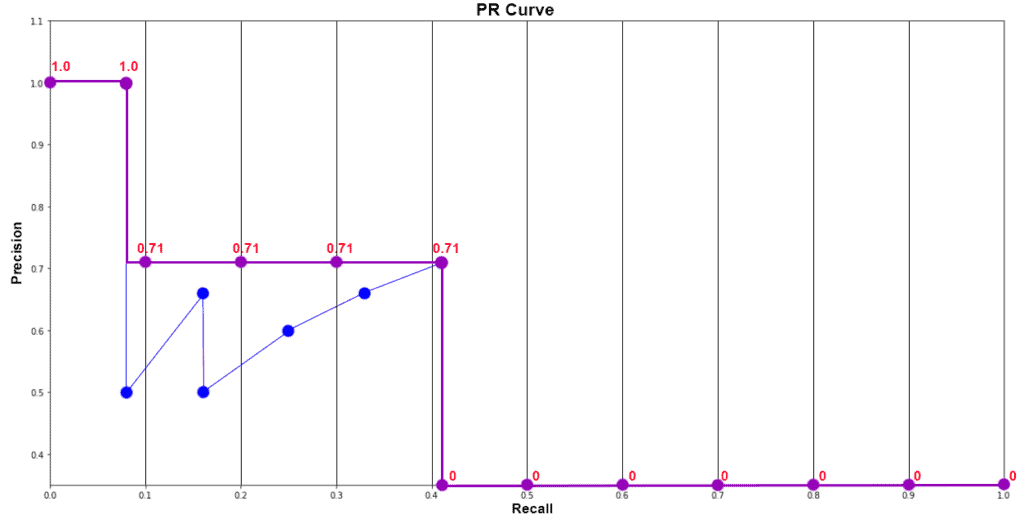
APdog = 1/11 * ( Sum of 11 interpolated Precision values )
= 1/11 * (1 + 4*0.71 + 6*0)
= 0.349
= 34.9%

Similarly, we calculate Average Precision(AP) for person, teddy, sheep, and truck. Make sure to calculate AP for at least two classes below for clear understanding. Once done, we will proceed with calculating Mean Average Precision (mAP).

3. What is Mean Average Precision (mAP)?
As the name suggests, Mean Average Precision or mAP is the average of AP over all detected classes.
mAP = 1/n * sum(AP), where n is the number of classes.
In the example above, we have 5 classes. Therefore, the calculated mAP is;
mAP = 1/5 * (0.349 + 0.545 + 0 + 1 + 0.5)
= 0.4788
= 47.88 %
To arrive at the mAP, while evaluating a model; Average Precision (AP) is calculated for each class separately.
Now let’s go back to the question that we skipped a while ago. Why Average Precision (AP) is it not calculated for all the classes at once?
Let’s think about what happens if we do. You can go back to the detection chart and calculate the AP by combining all classes. However, this time we would not be able to observe the class-wise performance. Consider a dataset having 3 classes, apple, bird, and butterfly. Let the number of training images be 1000. 20, and 1000. respectively. The model is bound to perform poorly in recognizing birds. This can be identified only when per class AP is calculated.
4. Evolution of Evaluation Metrics Over Time
This section is not necessarily specific to object detection. We will take a look at how evaluation metrics changed over time and the reasons behind it.
(4.1) ROC-AUC Metric, PASCAL VOC 2005
The metric was used to evaluate classification models. ROC (Receiver Operating Characteristic)-AUC (Area Under the Curve) metric was introduced in PASCAL VOC 2005. True Positive Rate (TPR) values are plotted corresponding to False Positive Rate (FPR) values.
Where,
TPR = TP / (TP + FN)
FPR = FP/(FP+FN)
(4.2) 11 Point Interpolation AP, PASCAL VOC 2007
We have already discussed the 11 Point Interpolation Method. It was introduced in the 2007 PASCAL VOC challenge. It is calculated at IoU threshold 0.5. This metric is more sensitive compared to ROC-AUC. The metric has the following advantages.
- Improve interpretability.
- Increased visibility to performance at low recall.
(4.3) PR-AUC, PASCAL VOC 2010
PR-AUC is the exact area under the Precision-Recall curve. Unlike the 11 Point Method, we don’t have to interpolate Precision values. And the final value is not divided by 11. This is also calculated at IoU threshold 0.5.
(4.4) 101 Point Interpolation AP, MS COCO 2014 | COCO mAP
Until now the metrics introduced by PASCAL VOC were the standard benchmarking system. However, with time models started saturating. It was observed that even models with equivalent scores were not performing equally. MS COCO introduced 101 Point Interpolation AP in 2014. It is a better approximation of AUC under the P-R curve.
Moreover, COCO made the challenge tougher by redefining the mAP@0.5 to mAP@[0.5:0.05:0.95]. Earlier, mAP was evaluated at IoU threshold 0.5. COCO mAP is calculated for a set of 10 different IoU thresholds and then averaged. It ranges from 0.5 to 0.95 at a step frequency of 0.05.
Apart from this, MS COCO has 12 metrics for evaluating object detection models.
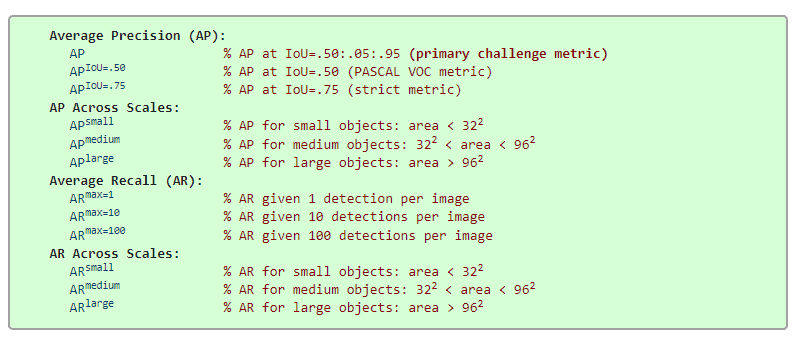
Note that MS COCO defines Average Precision (AP) as mAP@[0.5:.05:.95]. Here, the terms AP and mAP are used interchangeably. As of today, COCO mAP is the most popular metric for evaluating object detection models.
5. Datasets and Model Evaluation Competitions
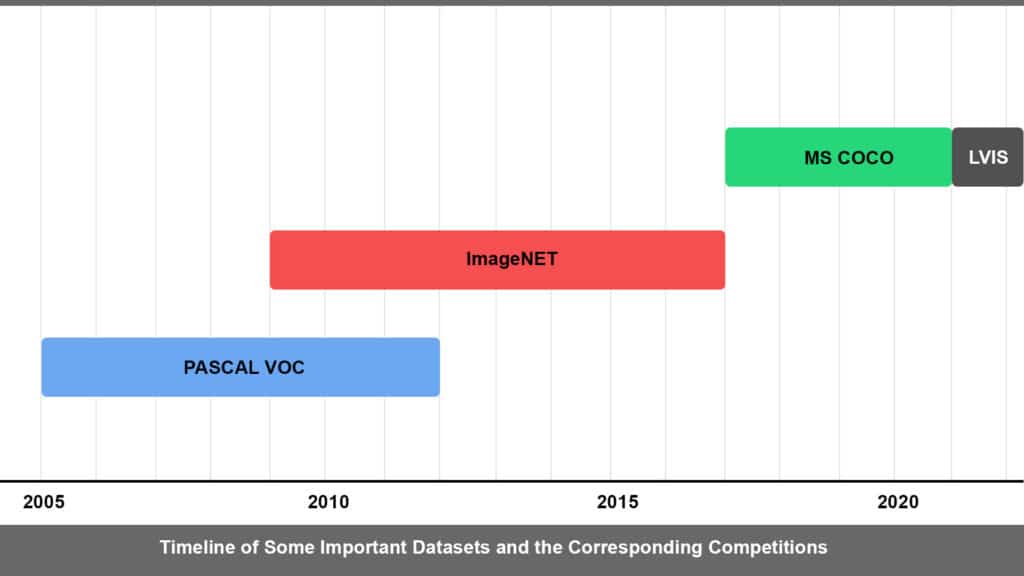
The AI boom that the world is experiencing today is possible not only because of the algorithms but also because of the datasets. At present, there are lots of datasets being used for a variety of tasks. We will discuss a few of them here.
5.1 PASCAL VOC (Visual Object Classes)

It was introduced first in the year 2005 with only 4 classes. Initially, it was used for classification and object detection. In 2007, segmentation tester was introduced and the number of classes increased to 20. With successive years further developments were incorporated and the dataset grew larger. As per the last update in 2012, PASCAL VOC has 11,530 images that have 20 classes, 27,450 ROI annotated objects and 6,929 segmentations.
Compared to other datasets, the PASCAL VOC dataset may be smaller but still is a good dataset to start with. Although the VOC challenge ended in 2012, the server still accepts submissions.
5.2 ImageNET
A revolutionary dataset, introduced in 2009. Many believe that it is the reason for the AI boom that we see today. When researchers were scrimmaging to develop better algorithms, ImageNET focused on the idea of a better dataset. It was found that even existing algorithms were performing better when trained on the ImageNET dataset. As of today, ImageNET has over 15 million images containing more than 20,000 categories.
In 2010 PASCAL VOC collaborated and co-branded their competition with ImageNet. ILSVRC (ImageNET Large Scale Visual Recognition Challenge) the annual contest organized by ImageNET continued till 2017. Through the contest, groundbreaking benchmarks were set up. The competition uses a trimmed set containing 150k images with 1000 categories. In 2017, the competition was passed onto Kaggle for hosting.
5.3 MS COCO (Microsoft Common Objects in Context)

Initially released in the year 2014, the MS COCO dataset was updated last in 2017. At present, It is the most commonly used dataset. COCO contains 328k images that have 80 classes and 1.5 million object instances. MS COCO competition and its rules are the current standards. However, the COCO server is no longer accepting submissions from 2021.
5.4 LVIS (Large Vocabulary Instance Segmentation)

LVIS is a dataset for long tail instance segmentation. It has 164k images that consist of annotations in over 1000 categories. It has a long tail of categories with few training samples. This means the dataset is imbalanced, making it even more challenging.
6. SUMMARY
So that’s all about Average Precision (AP) and Mean Average Precision (mAP). The following points were discussed throughout the post.
- Building blocks of Mean Average Precision (mAP).
- mAP for classification, object detection, and segmentation have different meanings and uses.
- Average Precision is not the average of Precision. It is the area under the P-R curve.
- Average Precision (AP) is calculated per class.
- ROC-AUC was the standard metric for evaluating classification models before 2007.
- 11 Point Interpolation AP was introduced in 2007.
- All Point AP was adopted later in 2010.
- PASCAL VOC and ImageNET challenge used AP and mAP calculated at 0.5 IoU.
- At present, MS COCO 101 point Average Precision (AP) is accepted as the standard metric.
- AP and mAP@[0.5:.05:.95] are the same according to MS COCO definition.
7. References
- Intersection over Union (IoU) in Object Detection and Segmentation
- Object Detection using YOLOv5 and OpenCV DNN in C++ and Python
- PASCAL VOC
- MS COCO
- ImageNET
- PASCAL VOC Server


100K+ Learners
Join Free OpenCV Bootcamp3 Hours of Learning