OpenTelemetry 
Enables requests served by NGINX for distributed telemetry via The OpenTelemetry Project.
Using the third party module opentelemetry-cpp-contrib/nginx the Ingress-Nginx Controller can configure NGINX to enable OpenTelemetry instrumentation. By default this feature is disabled.
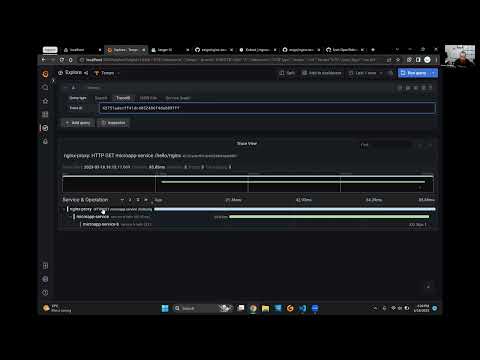
Check out this demo showcasing OpenTelemetry in Ingress NGINX. The video provides an overview and practical demonstration of how OpenTelemetry can be utilized in Ingress NGINX for observability and monitoring purposes.
Demo: OpenTelemetry in Ingress NGINX.
Usage 
To enable the instrumentation we must enable OpenTelemetry in the configuration ConfigMap:
data: enable-opentelemetry: "true" To enable or disable instrumentation for a single Ingress, use the enable-opentelemetry annotation:
kind: Ingress metadata: annotations: nginx.ingress.kubernetes.io/enable-opentelemetry: "true" We must also set the host to use when uploading traces:
otlp-collector-host: "otel-coll-collector.otel.svc" otlp-collector-host, you will need to point this to any backend that receives otlp-grpc. Next you will need to deploy a distributed telemetry system which uses OpenTelemetry. opentelemetry-collector, Jaeger, Tempo, and zipkin have been tested.
Other optional configuration options:
# specifies the name to use for the server span opentelemetry-operation-name # sets whether or not to trust incoming telemetry spans, Default: true opentelemetry-trust-incoming-span # specifies the port to use when uploading traces, Default: 4317 otlp-collector-port # specifies the service name to use for any traces created, Default: nginx otel-service-name # The maximum queue size. After the size is reached data are dropped, Default: 2048 otel-max-queuesize # The delay interval in milliseconds between two consecutive exports, Default: 5000 otel-schedule-delay-millis # The maximum batch size of every export. It must be smaller or equal to maxQueueSize, Default: 512 otel-max-export-batch-size # specifies sample rate for any traces created, Default: 0.01 otel-sampler-ratio # specifies the sampler to be used when sampling traces. # The available samplers are: AlwaysOn, AlwaysOff, TraceIdRatioBased, Default: AlwaysOn otel-sampler # Uses sampler implementation which by default will take a sample if parent Activity is sampled, Default: true otel-sampler-parent-based Note that you can also set whether to trust incoming spans (global default is true) per-location using annotations like the following:
kind: Ingress metadata: annotations: nginx.ingress.kubernetes.io/opentelemetry-trust-incoming-span: "true" Examples 
The following examples show how to deploy and test different distributed telemetry systems. These example can be performed using Docker Desktop.
In the esigo/nginx-example GitHub repository is an example of a simple hello service:
graph TB subgraph Browser start["http://esigo.dev/hello/nginx"] end subgraph app sa[service-a] sb[service-b] sa --> |name: nginx| sb sb --> |hello nginx!| sa end subgraph otel otc["Otel Collector"] end subgraph observability tempo["Tempo"] grafana["Grafana"] backend["Jaeger"] zipkin["Zipkin"] end subgraph ingress-nginx ngx[nginx] end subgraph ngx[nginx] ng[nginx] om[OpenTelemetry module] end subgraph Node app otel observability ingress-nginx om --> |otlp-gRPC| otc --> |jaeger| backend otc --> |zipkin| zipkin otc --> |otlp-gRPC| tempo --> grafana sa --> |otlp-gRPC| otc sb --> |otlp-gRPC| otc start --> ng --> sa endTo install the example and collectors run:
-
Enable OpenTelemetry and set the otlp-collector-host:
$ echo ' apiVersion: v1 kind: ConfigMap data: enable-opentelemetry: "true" opentelemetry-config: "/etc/ingress-controller/telemetry/opentelemetry.toml" opentelemetry-operation-name: "HTTP $request_method $service_name $uri" opentelemetry-trust-incoming-span: "true" otlp-collector-host: "otel-coll-collector.otel.svc" otlp-collector-port: "4317" otel-max-queuesize: "2048" otel-schedule-delay-millis: "5000" otel-max-export-batch-size: "512" otel-service-name: "nginx-proxy" # Opentelemetry resource name otel-sampler: "AlwaysOn" # Also: AlwaysOff, TraceIdRatioBased otel-sampler-ratio: "1.0" otel-sampler-parent-based: "false" metadata: name: ingress-nginx-controller namespace: ingress-nginx ' | kubectl replace -f - -
Deploy otel-collector, grafana and Jaeger backend:
# add helm charts needed for grafana and OpenTelemetry collector helm repo add open-telemetry https://open-telemetry.github.io/opentelemetry-helm-charts helm repo add grafana https://grafana.github.io/helm-charts helm repo update # deploy cert-manager needed for OpenTelemetry collector operator kubectl apply -f https://github.com/cert-manager/cert-manager/releases/download/v1.15.3/cert-manager.yaml # create observability namespace kubectl apply -f https://raw.githubusercontent.com/esigo/nginx-example/main/observability/namespace.yaml # install OpenTelemetry collector operator helm upgrade --install otel-collector-operator -n otel --create-namespace open-telemetry/opentelemetry-operator # deploy OpenTelemetry collector kubectl apply -f https://raw.githubusercontent.com/esigo/nginx-example/main/observability/collector.yaml # deploy Jaeger all-in-one kubectl apply -f https://github.com/jaegertracing/jaeger-operator/releases/download/v1.37.0/jaeger-operator.yaml -n observability kubectl apply -f https://raw.githubusercontent.com/esigo/nginx-example/main/observability/jaeger.yaml -n observability # deploy zipkin kubectl apply -f https://raw.githubusercontent.com/esigo/nginx-example/main/observability/zipkin.yaml -n observability # deploy tempo and grafana helm upgrade --install tempo grafana/tempo --create-namespace -n observability helm upgrade -f https://raw.githubusercontent.com/esigo/nginx-example/main/observability/grafana/grafana-values.yaml --install grafana grafana/grafana --create-namespace -n observability -
Build and deploy demo app:
# build images make images # deploy demo app: make deploy-app -
Make a few requests to the Service:
kubectl port-forward --namespace=ingress-nginx service/ingress-nginx-controller 8090:80 curl http://esigo.dev:8090/hello/nginx StatusCode : 200 StatusDescription : OK Content : {"v":"hello nginx!"} RawContent : HTTP/1.1 200 OK Connection: keep-alive Content-Length: 21 Content-Type: text/plain; charset=utf-8 Date: Mon, 10 Oct 2022 17:43:33 GMT {"v":"hello nginx!"} Forms : {} Headers : {[Connection, keep-alive], [Content-Length, 21], [Content-Type, text/plain; charset=utf-8], [Date, Mon, 10 Oct 2022 17:43:33 GMT]} Images : {} InputFields : {} Links : {} ParsedHtml : System.__ComObject RawContentLength : 21 -
View the Grafana UI:
In the Grafana interface we can see the details:kubectl port-forward --namespace=observability service/grafana 3000:80
-
View the Jaeger UI:
In the Jaeger interface we can see the details:kubectl port-forward --namespace=observability service/jaeger-all-in-one-query 16686:16686
-
View the Zipkin UI:
In the Zipkin interface we can see the details:kubectl port-forward --namespace=observability service/zipkin 9411:9411
Migration from OpenTracing, Jaeger, Zipkin and Datadog 
If you are migrating from OpenTracing, Jaeger, Zipkin, or Datadog to OpenTelemetry, you may need to update various annotations and configurations. Here are the mappings for common annotations and configurations:
Annotations 
| Legacy | OpenTelemetry |
|---|---|
nginx.ingress.kubernetes.io/enable-opentracing | nginx.ingress.kubernetes.io/enable-opentelemetry |
nginx.ingress.kubernetes.io/opentracing-trust-incoming-span | nginx.ingress.kubernetes.io/opentelemetry-trust-incoming-span |
Configs 
| Legacy | OpenTelemetry |
|---|---|
opentracing-operation-name | opentelemetry-operation-name |
opentracing-location-operation-name | opentelemetry-operation-name |
opentracing-trust-incoming-span | opentelemetry-trust-incoming-span |
zipkin-collector-port | otlp-collector-port |
zipkin-service-name | otel-service-name |
zipkin-sample-rate | otel-sampler-ratio |
jaeger-collector-port | otlp-collector-port |
jaeger-endpoint | otlp-collector-port, otlp-collector-host |
jaeger-service-name | otel-service-name |
jaeger-propagation-format | N/A |
jaeger-sampler-type | otel-sampler |
jaeger-sampler-param | otel-sampler |
jaeger-sampler-host | N/A |
jaeger-sampler-port | N/A |
jaeger-trace-context-header-name | N/A |
jaeger-debug-header | N/A |
jaeger-baggage-header | N/A |
jaeger-tracer-baggage-header-prefix | N/A |
datadog-collector-port | otlp-collector-port |
datadog-service-name | otel-service-name |
datadog-environment | N/A |
datadog-operation-name-override | N/A |
datadog-priority-sampling | otel-sampler |
datadog-sample-rate | otel-sampler-ratio |
