

How to Use C# to Create Excel Charts

The following How-To enables you to create an Excel chart programmatically in C# using IronXL.
Programmatically Create Excel Charts in .NET

How to Create Excel Chart in C#
- Install Excel library to create Excel charts.
- Load the existing Excel file into a
Workbookobject. - Create a chart with
CreateChart. - Set the chart's title and legend
- Call the
Plotmethod. - Save the
Workbookto the Excel file.
Step 1
1. Install IronXL
First, the easiest way to install IronXL is to make use of the NuGet Package manager in Visual Studio:
- Select the Project menu
- Manage NuGet Packages
- Search for IronXL.Excel
- Install
You could also enter the following command into the Developer Command Prompt:
Install-Package IronXL.Excel
Or Download from here: https://ironsoftware.com/csharp/excel/packages/IronXL.zip
How to Tutorial
2. Create Excel Chart for .NET
Now for the project!
Add the following details into an Excel Spreadsheet. This is shown below:
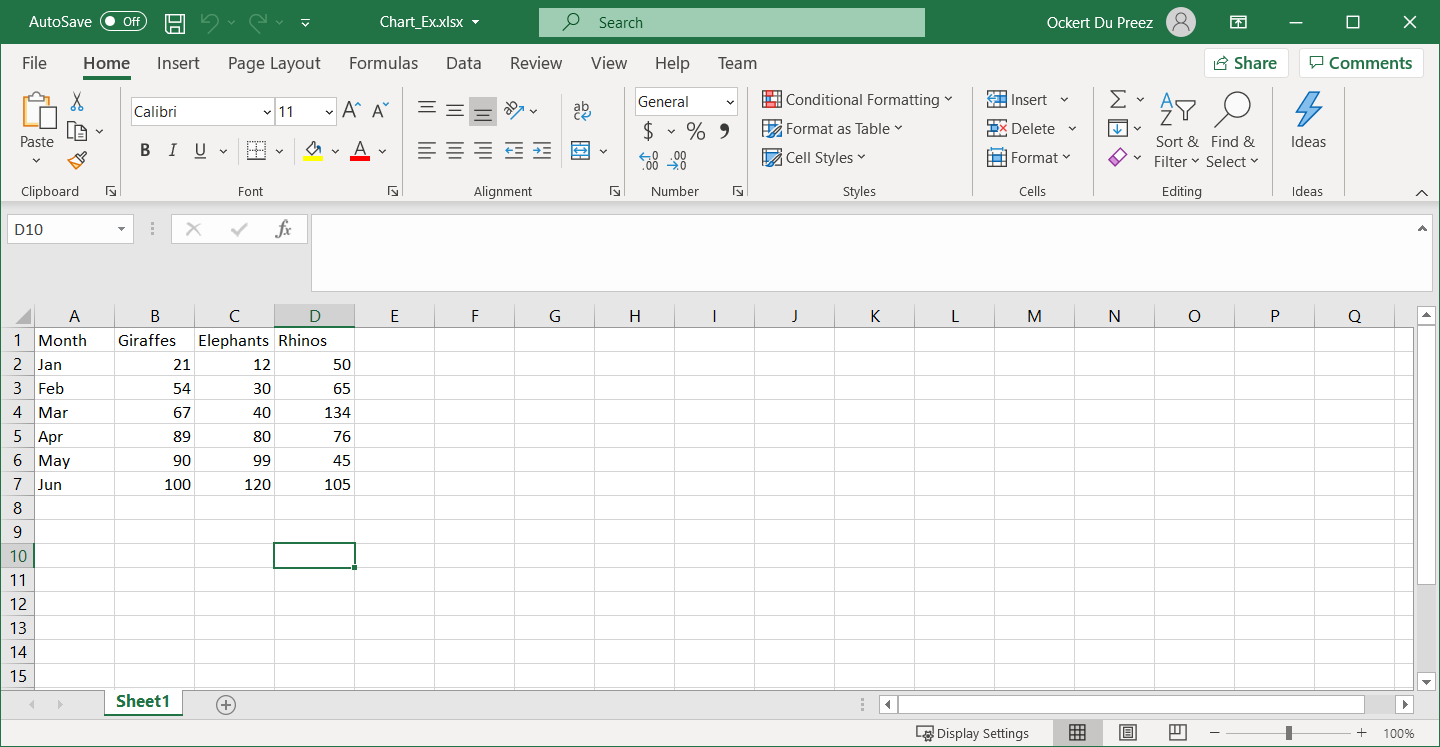
Figure 1 – Data to be used for charting
Add the Namespaces necessary to work with Excel charts in IronXL.
using IronXL; using IronXL.Drawing.Charts;using IronXL; using IronXL.Drawing.Charts;Imports IronXL Imports IronXL.Drawing.ChartsAdd code to create the Excel graph programmatically with IronXL:
// This method is triggered by a button click event private void button1_Click(object sender, EventArgs e) { // Load the existing Excel workbook WorkBook wb = WorkBook.Load("Chart_Ex.xlsx"); // Use the default worksheet from the workbook WorkSheet ws = wb.DefaultWorkSheet; // Create a column chart at the specified range of cells var chart = ws.CreateChart(ChartType.Column, 10, 15, 25, 20); // Define the range for the x-axis data const string xAxis = "A2:A7"; // Add a series for the chart using data in the range and give it a title from the first row var series = chart.AddSeries(xAxis, "B2:B7"); series.Title = ws["B1"].StringValue; // Add another series series = chart.AddSeries(xAxis, "C2:C7"); series.Title = ws["C1"].StringValue; // Add a third series series = chart.AddSeries(xAxis, "D2:D7"); series.Title = ws["D1"].StringValue; // Set the chart title chart.SetTitle("Column Chart"); // Position the legend at the bottom of the chart chart.SetLegendPosition(LegendPosition.Bottom); // Plot the chart with the provided data chart.Plot(); // Save the workbook with the newly added chart wb.SaveAs("Exported_Column_Chart.xlsx"); }// This method is triggered by a button click event private void button1_Click(object sender, EventArgs e) { // Load the existing Excel workbook WorkBook wb = WorkBook.Load("Chart_Ex.xlsx"); // Use the default worksheet from the workbook WorkSheet ws = wb.DefaultWorkSheet; // Create a column chart at the specified range of cells var chart = ws.CreateChart(ChartType.Column, 10, 15, 25, 20); // Define the range for the x-axis data const string xAxis = "A2:A7"; // Add a series for the chart using data in the range and give it a title from the first row var series = chart.AddSeries(xAxis, "B2:B7"); series.Title = ws["B1"].StringValue; // Add another series series = chart.AddSeries(xAxis, "C2:C7"); series.Title = ws["C1"].StringValue; // Add a third series series = chart.AddSeries(xAxis, "D2:D7"); series.Title = ws["D1"].StringValue; // Set the chart title chart.SetTitle("Column Chart"); // Position the legend at the bottom of the chart chart.SetLegendPosition(LegendPosition.Bottom); // Plot the chart with the provided data chart.Plot(); // Save the workbook with the newly added chart wb.SaveAs("Exported_Column_Chart.xlsx"); }' This method is triggered by a button click event Private Sub button1_Click(ByVal sender As Object, ByVal e As EventArgs) ' Load the existing Excel workbook Dim wb As WorkBook = WorkBook.Load("Chart_Ex.xlsx") ' Use the default worksheet from the workbook Dim ws As WorkSheet = wb.DefaultWorkSheet ' Create a column chart at the specified range of cells Dim chart = ws.CreateChart(ChartType.Column, 10, 15, 25, 20) ' Define the range for the x-axis data Const xAxis As String = "A2:A7" ' Add a series for the chart using data in the range and give it a title from the first row Dim series = chart.AddSeries(xAxis, "B2:B7") series.Title = ws("B1").StringValue ' Add another series series = chart.AddSeries(xAxis, "C2:C7") series.Title = ws("C1").StringValue ' Add a third series series = chart.AddSeries(xAxis, "D2:D7") series.Title = ws("D1").StringValue ' Set the chart title chart.SetTitle("Column Chart") ' Position the legend at the bottom of the chart chart.SetLegendPosition(LegendPosition.Bottom) ' Plot the chart with the provided data chart.Plot() ' Save the workbook with the newly added chart wb.SaveAs("Exported_Column_Chart.xlsx") End SubA Workbook object and a Worksheet object are created. The CreateChart method of the Worksheet object gets called to specify the chart type and chart location. The chart’s series get added, with its Title and the Legend. This is shown below.
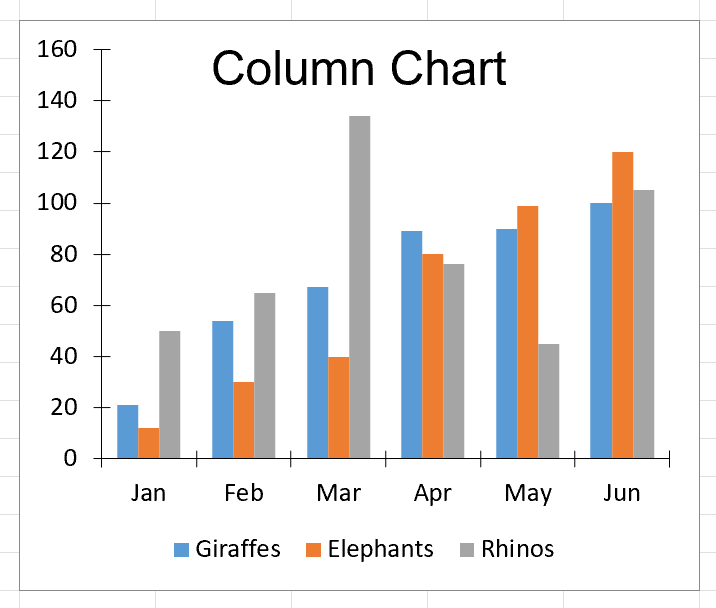
Figure 2 – Chart output
Library Quick Access
IronXL API Reference Documentation
Learn more and share how to merge, unmerge, and work with cells in Excel spreadsheets using the handy IronXL API Reference Documentation.
IronXL API Reference Documentation
Frequently Asked Questions
What is this library used for working with Excel files?
IronXL is a library that allows developers to work with Excel files programmatically using C# and .NET.
How do I install the necessary library for Excel manipulation?
You can install IronXL via the NuGet Package Manager in Visual Studio by searching for IronXL.Excel and clicking install. Alternatively, use the command 'Install-Package IronXL.Excel' in the Developer Command Prompt.
How can I create an Excel chart programmatically?
To create an Excel chart with IronXL, load an existing Excel file into a Workbook object, create a chart using the CreateChart method, add data series, set the title and legend, and save the workbook.
What types of charts can be created programmatically in Excel?
IronXL supports various chart types such as Column, Bar, Line, and Pie charts, among others.
How do I add a data series to a chart programmatically?
You can add a data series to a chart using the AddSeries method of the chart object, specifying the range for the x-axis and y-axis data, and optionally setting a title for the series.
Can I customize the chart legend position programmatically?
Yes, you can customize the legend position using the SetLegendPosition method, specifying positions like Bottom, Top, Left, or Right.
How do I save an Excel file after creating a chart programmatically?
After creating a chart, you can save the Excel file using the SaveAs method of the Workbook object, specifying the desired file path and name.
What namespaces are required to work with Excel charts programmatically?
To work with Excel charts in IronXL, include the namespaces IronXL and IronXL.Drawing.Charts.
Is there documentation available for this Excel library?
Yes, you can access the IronXL API Reference Documentation on their website to learn more about its features and how to use them.
Can this library be used to modify existing Excel files?
Yes, IronXL can be used to load, edit, and save existing Excel files, allowing you to modify data, add charts, and perform other operations programmatically.


