[hadoop] Add Hadoop package #2614
Conversation
db9f223 to 8d5ec52 Compare 💔 Build Failed
Expand to view the summary
Build stats
Steps errors Expand to view the steps failures
|
| Pinging @elastic/integrations (Team:Integrations) |
 mtojek left a comment
There was a problem hiding this comment.
Few nit-picks to clarify, otherwise, it looks fine to me.
packages/hadoop/data_stream/expanded_cluster_metrics/_dev/test/system/test-metric-config.yml Outdated Show resolved Hide resolved
packages/hadoop/manifest.yml Outdated
| - monitoring | ||
| release: beta | ||
| conditions: | ||
| kibana.version: ^7.16.0 || ^8.0.0 |
There was a problem hiding this comment.
That's probably what we'd like to adjust? cc @akshay-saraswat we target 8.0, right?
| @@ -0,0 +1,100 @@ | |||
| FROM centos:7 | |||
There was a problem hiding this comment.
If we have to build a custom Docker image, we're trying to use the Ubuntu base image, so that's most likely something to be adjusted.
Also, a standard question, is there any official Docker image for Hadoop, we can reuse here? Did you check them?
There was a problem hiding this comment.
Sure, updated the system tests to use the Ubuntu base image. Please verify.
Yes, I did check for the official Docker images for Hadoop but there is no such image that we can reuse here. That is the reason we decided to go with building custom Docker image.
There was a problem hiding this comment.
What was wrong with that image: https://hub.docker.com/r/apache/hadoop/?
There was a problem hiding this comment.
We tried using the same docker image but ran into this issue:
Error response from daemon: manifest for apache/hadoop:latest not found: manifest unknown: manifest unknown
So, we decided to go with building a custom Docker image.
In addition to this, after updating the base image to Ubuntu, the system tests for jolokia_metrics data stream is failing in the CI. The reason for it seems to be the unavailability of the ports. The tests are passing successfully in our local environment. Can you please guide us on which port we should use for the same?
Thanks!
There was a problem hiding this comment.
The latest tag isn't present. Please take a look at available tags for apache/hadoop.
I can download apache/hadoop:2 and apache/hadoop:3.
There was a problem hiding this comment.
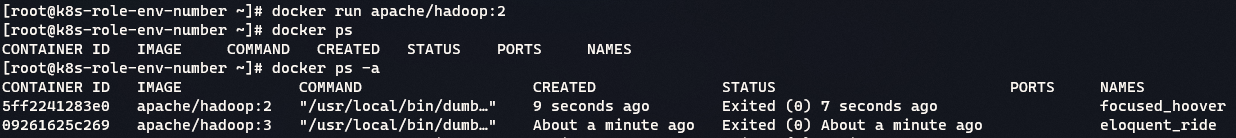
Tried it with the images apache/hadoop:2 and apache/hadoop:3, the images got downloaded but when we try running a container it gets exited as we checked the status with docker ps -a which showed us that the container got exited. When we tried opening the logs for the exited container, the logs are empty. Do you have any other suggestions over the same?
There was a problem hiding this comment.
You should jump into the image and check what's inside the starter.sh. For example:
docker run -it apache/hadoop:3 sh sh-4.2$ cat /opt/starter.sh Then, you can look for any online help for it, and find a post on flokkr, which contains a ready docker-compose setup.
For example to start a data node, which will fail in standalone setup:
docker run -it apache/hadoop:3 hdfs datanode There was a problem hiding this comment.
Thank you for the guidance. Let me try these things out.
There was a problem hiding this comment.
The following two are the errors that we are facing with the system tests using official Docker image for Hadoop:
localhost: ssh: connect to host localhost port 22: Network is unreachable ERROR: Cannot set priority of resourcemanager process 138 There was a problem hiding this comment.
Why do you need the SSH configuration there?
| /test |
| @@ -0,0 +1,23 @@ | |||
| #!/bin/bash | |||
There was a problem hiding this comment.
What's wrong with the original entrypoint? Did you try to replace (via mount) the hadoop-env.sh file?
| sudo /opt/hadoop/bin/hdfs namenode -format | ||
| sudo /opt/hadoop/sbin/start-dfs.sh | ||
| export PDSH_RCMD_TYPE=ssh | ||
| sudo /opt/hadoop/sbin/start-yarn.sh |
There was a problem hiding this comment.
Doesn't yarn start in the original entrypoint?
mtojek left a comment
There was a problem hiding this comment.
@yug-elastic I tried to use apache/hadoop:3 image and didn't face any serious problems. My setup:
config:
CORE-SITE.XML_fs.default.name=hdfs://namenode:9000 CORE-SITE.XML_fs.defaultFS=hdfs://namenode:9000 HDFS-SITE.XML_dfs.namenode.rpc-address=namenode:9000 HDFS-SITE.XML_dfs.replication=1 LOG4J.PROPERTIES_log4j.rootLogger=INFO, stdout LOG4J.PROPERTIES_log4j.appender.stdout=org.apache.log4j.ConsoleAppender LOG4J.PROPERTIES_log4j.appender.stdout.layout=org.apache.log4j.PatternLayout LOG4J.PROPERTIES_log4j.appender.stdout.layout.ConversionPattern=%d{yyyy-MM-dd HH:mm:ss} %-5p %c{1}:%L - %m%n MAPRED-SITE.XML_mapreduce.framework.name=yarn MAPRED-SITE.XML_yarn.app.mapreduce.am.env=HADOOP_MAPRED_HOME=/opt/hadoop MAPRED-SITE.XML_mapreduce.map.env=HADOOP_MAPRED_HOME=/opt/hadoop MAPRED-SITE.XML_mapreduce.reduce.env=HADOOP_MAPRED_HOME=/opt/hadoop YARN-SITE.XML_yarn.resourcemanager.hostname=resourcemanager YARN-SITE.XML_yarn.nodemanager.pmem-check-enabled=false YARN-SITE.XML_yarn.nodemanager.delete.debug-delay-sec=600 YARN-SITE.XML_yarn.nodemanager.vmem-check-enabled=false YARN-SITE.XML_yarn.nodemanager.aux-services=mapreduce_shuffle CAPACITY-SCHEDULER.XML_yarn.scheduler.capacity.maximum-applications=10000 CAPACITY-SCHEDULER.XML_yarn.scheduler.capacity.maximum-am-resource-percent=0.1 CAPACITY-SCHEDULER.XML_yarn.scheduler.capacity.resource-calculator=org.apache.hadoop.yarn.util.resource.DefaultResourceCalculator CAPACITY-SCHEDULER.XML_yarn.scheduler.capacity.root.queues=default CAPACITY-SCHEDULER.XML_yarn.scheduler.capacity.root.default.capacity=100 CAPACITY-SCHEDULER.XML_yarn.scheduler.capacity.root.default.user-limit-factor=1 CAPACITY-SCHEDULER.XML_yarn.scheduler.capacity.root.default.maximum-capacity=100 CAPACITY-SCHEDULER.XML_yarn.scheduler.capacity.root.default.state=RUNNING CAPACITY-SCHEDULER.XML_yarn.scheduler.capacity.root.default.acl_submit_applications=* CAPACITY-SCHEDULER.XML_yarn.scheduler.capacity.root.default.acl_administer_queue=* CAPACITY-SCHEDULER.XML_yarn.scheduler.capacity.node-locality-delay=40 CAPACITY-SCHEDULER.XML_yarn.scheduler.capacity.queue-mappings= CAPACITY-SCHEDULER.XML_yarn.scheduler.capacity.queue-mappings-override.enable=false docker-compose.yml:
version: "3" services: namenode: image: apache/hadoop:${HADOOP_VERSION} hostname: namenode command: ["hdfs", "namenode"] ports: - 50070:50070 - 9870:9870 env_file: - config environment: ENSURE_NAMENODE_DIR: "/tmp/hadoop-hadoop/dfs/name" datanode: image: apache/hadoop:${HADOOP_VERSION} command: ["hdfs", "datanode"] ports: - 9864:9864 links: - namenode env_file: - config resourcemanager: image: apache/hadoop:${HADOOP_VERSION} hostname: resourcemanager command: ["yarn", "resourcemanager"] ports: - 8088:8088 env_file: - config volumes: - ./testdata:/opt/testdata nodemanager: image: apache/hadoop:${HADOOP_VERSION} command: ["yarn","nodemanager"] ports: - 8042:8042 links: - resourcemanager - namenode env_file: - config I haven't written any custom Dockerfile. I guess this YML can be improved with healthchecks. Anyways, the JMX is alredy exposed.
| hadoop: | ||
| build: | ||
| context: ./Dockerfiles | ||
| dockerfile: Dockerfile-namenode |
There was a problem hiding this comment.
@yug-elastic Why do we need a custom Dockerfile? Is there something wrong with the original entry point? Correct if I'm wrong, but JMX was already exposed there?
There was a problem hiding this comment.
You're right, but we are using Jolokia which, as per our understanding wraps JMX. That is why we have added a custom Dockerfile here inside which we setup Jolokia and configure Hadoop with it. Does that make sense?
There was a problem hiding this comment.
Consider the docker-compose I provided you, without customer Dockerfile.
If you go to the http://localhost:9864/jmx, you can fetch all these metrics and don't have to install Jolokia, right? This is because there is the Metrics2 framework exposed.
Please check if that API differs much from Jolokia. We shouldn't force users to install extensions if there is native support.
WDYT?
| # sxSmbIUfc2SGJGCJD4I= | ||
| # -----END CERTIFICATE----- | ||
| owner: | ||
| github: elastic/integrations |
There was a problem hiding this comment.
Please add an entry for this package in .github/CODEOWNERS.
There was a problem hiding this comment.
Sure. Added it.
| /test |
mtojek left a comment
There was a problem hiding this comment.
It was missed in previous rounds but spotted in Apache Spark PR, and applies also here:
We need to split metrics into logical areas: application and cluster is fine, but jolokia_metrics doesn't refer to an area, but rather a message channel. To be honest, we should iterate also on Cassandra as it looks poor compared to this integration, but let's leave it for another story.
| type: group | ||
| release: beta | ||
| fields: | ||
| - name: application_metrics |
There was a problem hiding this comment.
I don't understand these metrics here. They look like random data points put in the same bucket. What exactly does memory_seconds mean? Why in the same group do we have time, running containers, vcore (?), and progress?
There was a problem hiding this comment.
memory_seconds = The amount of memory the application has allocated
We have put these fields in the same bucket with reference to the PRD. Please check this link.
| @@ -0,0 +1,72 @@ | |||
| - name: hadoop.metrics | |||
There was a problem hiding this comment.
This feedback applies to all metrics published - we need descriptions. How the end-user will know which field means what?
There was a problem hiding this comment.
Makes sense, we'll update the same.
Okay, we'll need to iterate on this then. As of now, we have the following types of metrics as a part of |
| It sounds good to me, but don't hesitate to split it into smaller data streams if there are logical reasons to do this.
As long as it doesn't require any development in Metricbeat, I'm good with that as well. |
I don't think it would require any development in Metricbeat. What do you recommend? |
| Thanks for passing links. There aren't too many metrics, so I would merge those into a single cluster metrics data stream. Unless it's a complex operation to merge them, then let's keep them separate :) |
| Based on the previous discussion, it seems still some refactoring on the metrics side is needed. I would recommend the same approach for this PR as discussed in #2811 (comment) |
| Same question as for the other PR's: Which one should we start with review as the foundation? Lets put the others in draft. |
| title: "Hadoop" | ||
| version: 0.1.0 | ||
| license: basic | ||
| description: "This Elastic integration collects metrics from hadoop." |
There was a problem hiding this comment.
Collect metrics from Apache Hadoop with Elastic Agent.
Let's be consistent with other integrations. This description shows up as a summary of the integration tile in the integrations UI. Otherwise, this PR looks good to me.
There was a problem hiding this comment.
Thanks for the approval, @akshay-saraswat!
Makes sense, I have made the description consistent as a part of this PR.
Quick reference: https://github.com/elastic/integrations/pull/2953/files#diff-b6b7daea47c22ecde7384eb883e3f257488dc5ce3bae2bc1ecbdd7097b93df7aR6
| Closing this PR as it was split up into multiple PRs as discussed in the comment #2614 (comment). All the parts are now merged and the linked issue (#1543) has been closed. Thanks a lot @mtojek, @akshay-saraswat and @lalit-satapathy for taking out time to review the PRs and providing valuable feedback! |
What does this PR do?
Checklist
changelog.ymlfile.manifest.ymlfile to point to the latest Elastic stack release (e.g.^7.13.0).How to test this PR locally
Screenshots