A work in progress fix for the default javafx chart class to allow combining multiple chart types in one chart object. Currently JavaFX does not support to create a composite chart using different series types. Java 10 required!**
- Fixed value markers
- Different chart types in one chart
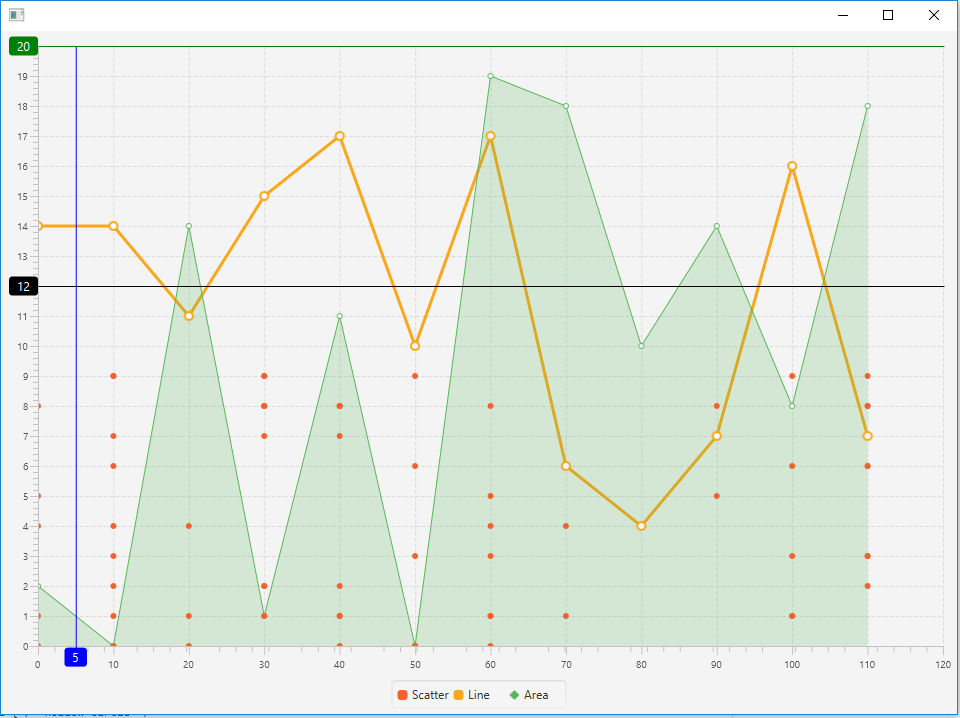
//Create a chart MultiTypeChart<Number, Number> multiTypeChart= new MultiTypeChart<>(new NumberAxis(), new NumberAxis()); //Create series as usual Series<Number,Number> line = new Series<>(); line.setName("Line"); Series<Number,Number> scatter = new Series<>(); scatter.setName("Scatter"); Series<Number,Number> area = new Series<>(); area.setName("Area"); //Wrap series in a typed series object multiTypeChart.addSeries(new TypedSeries<>(scatter,SeriesType.SCATTER)); multiTypeChart.addSeries(new TypedSeries<>(line,SeriesType.LINE)); multiTypeChart.addSeries(new TypedSeries<>(area,SeriesType.AREA)); //Add/remove value markers boolean showLabel = true; multiTypeChart.addValueMarker(new ValueMarker<Number>(5,true,Color.BLUE,showLabel)); multiTypeChart.addValueMarker(new ValueMarker<Number>(12,false,Color.BLACK,showLabel)); multiTypeChart.addValueMarker(new ValueMarker<Number>(20,false,Color.GREEN,showLabel)); //Add data for(...){ line.getData().add(new Data<Number, Number>(x,y); }Due to the API containing a lot of private and final methods the result is rather lackluster and just works good enough if somone does not look at the code. (A lot of copy and pasted code, switch statements and almost no indication of OOP). Java 9/10 discourage "illegal" reflection access usage and byte code manipulation in conjunction with a custom class loader to circumvent the final restrictions seem a bit overkill for such a feature. This should only be considered a hack until the api caught up until the jdk feature request is resolved.
- Support all basic chart types
- potential ObservableValue resource leak if series get added and removed
- implement animation code
- implement remove series action
- make full use of beans.observable.values
**I think there is one usage of var and no streams or anything else, so if you want to backport it to Java <8 it should take 2 minutes.