
Quickstart: Tracing:
Learn how to trace your LLM application in Arize AX
Tracing lets you capture, inspect, and debug every step of your LLM or agent workflow — from user prompts to model responses and tool calls. With Arize AX tracing, you can visualize execution flow, surface bottlenecks, and understand model behavior in real time.
Choose your Path to getting started: You can follow along step-by-step, or dive straight into examples.


In this quickstart, you’ll learn how to:
Install the tracing packages
Get your API keys & connect to Arize AX
Add tracing to your application
Run your application and start viewing traces
By the end, you’ll have tracing fully integrated into your application — ready to explore spans, latency breakdowns, and context propagation in the Arize AX dashboard.
Step by Step
1. Install our tracing packages
Run the following commands below to install our open source tracing packages, which works on top of OpenTelemetry. This example below uses openai, and we support many LLM providers (see full list).
Using pip:
pip install arize-otel openai openinference-instrumentation-openai opentelemetry-exporter-otlpUsing conda:
conda install -c conda-forge openai openinference-instrumentation-openai opentelemetry-exporter-otlpInstall with npm
npm install @arizeai/openinference-instrumentation-openai @opentelemetry/exporter-trace-otlp-grpc @grpc/grpc-js2. Get your API keys
Go to your space settings in the left navigation, and create a key using the button below.

3. Add our tracing code
Arize AX is an OpenTelemetry collector, which means you can configure your tracer and span processor. For more OTEL configurability, see how to set your tracer for auto instrumentors.
The package we are using is arize-otel, which is a lightweight convenience package to set up OpenTelemetry and send traces to Arize AX.
Python and JS/TS examples are shown below.
The following code snippet showcases how to automatically instrument your OpenAI application.
# Import open-telemetry dependencies from arize.otel import register # Setup OTel via our convenience function tracer_provider = register( space_id = "your-space-id", # in app space settings page api_key = "your-api-key", # in app space settings page project_name = "your-project-name", # name this to whatever you would like ) # Import the automatic instrumentor from OpenInference from openinference.instrumentation.openai import OpenAIInstrumentor # Finish automatic instrumentation OpenAIInstrumentor().instrument(tracer_provider=tracer_provider)Set OpenAI Key:
import os from getpass import getpass os.environ["OPENAI_API_KEY"] = getpass("OpenAI API key")To test, let's send a chat request to OpenAI:
import openai client = openai.OpenAI() response = client.chat.completions.create( model="gpt-3.5-turbo", messages=[{"role": "user", "content": "Write a haiku."}], max_tokens=20, ) print(response.choices[0].message.content)Now start asking questions to your LLM app and watch the traces being collected by Arize.
The following code snippet implements instrumentation for an OpenAI client in typescript.
/*instrumentation.ts */ import { registerInstrumentations } from "@opentelemetry/instrumentation"; import { OpenAIInstrumentation } from "@arizeai/openinference-instrumentation-openai"; import { ConsoleSpanExporter } from "@opentelemetry/sdk-trace-base"; import { NodeTracerProvider, BatchSpanProcessor, } from "@opentelemetry/sdk-trace-node"; import { Resource } from "@opentelemetry/resources"; import { OTLPTraceExporter as GrpcOTLPTraceExporter } from "@opentelemetry/exporter-trace-otlp-grpc"; // Arize specific import { diag, DiagConsoleLogger, DiagLogLevel } from "@opentelemetry/api"; import { Metadata } from "@grpc/grpc-js" // For troubleshooting, set the log level to DiagLogLevel.DEBUG diag.setLogger(new DiagConsoleLogger(), DiagLogLevel.DEBUG); // Arize specific - Create metadata and add your headers const metadata = new Metadata(); // Your Arize Space and API Keys, which can be found in the UI metadata.set('space_id', 'your-space-id'); metadata.set('api_key', 'your-api-key'); const provider = new NodeTracerProvider({ resource: new Resource({ // Arize specific - The name of a new or preexisting model you // want to export spans to "model_id": "your-model-id", "model_version": "your-model-version" }), }); provider.addSpanProcessor(new BatchSpanProcessor(new ConsoleSpanExporter())); provider.addSpanProcessor( new BatchSpanProcessor( new GrpcOTLPTraceExporter({ url: "https://otlp.arize.com/v1", metadata, }), ), ); registerInstrumentations({ instrumentations: [new OpenAIInstrumentation({})], }); provider.register();You can also follow our example application at the OpenInference github.

The following code snippet showcases how to automatically instrument your LLM application.
import os # Import open-telemetry dependencies from arize.otel import register # Setup OTel via our convenience function tracer_provider = register( space_id = "your-space-id", # in app space settings page api_key = "your-api-key", # in app space settings page project_name = "your-project-name", # name this to whatever you would like ) # Import the automatic instrumentor from OpenInference from openinference.instrumentation.llama_index import LlamaIndexInstrumentor # Finish automatic instrumentation LlamaIndexInstrumentor().instrument(tracer_provider=tracer_provider)To test, you can create a simple RAG application using LlamaIndex.
from gcsfs import GCSFileSystem from llama_index.core import ( Settings, StorageContext, load_index_from_storage, ) from llama_index.embeddings.openai import OpenAIEmbedding from llama_index.llms.openai import OpenAI file_system = GCSFileSystem(project="public-assets-275721") index_path = "arize-phoenix-assets/datasets/unstructured/llm/llama-index/arize-docs/index/" storage_context = StorageContext.from_defaults( fs=file_system, persist_dir=index_path, ) Settings.llm = OpenAI(model="gpt-4-turbo-preview") Settings.embed_model = OpenAIEmbedding(model="text-embedding-ada-002") index = load_index_from_storage( storage_context, ) query_engine = index.as_query_engine() response = query_engine.query("What is Arize and how can it help me as an AI Engineer?") Now start asking questions to your LLM app and watch the traces being collected by Arize.🦙
The following code snippet showcases how to automatically instrument your LLM application.
import os # Import open-telemetry dependencies from arize.otel import register # Setup OTel via our convenience function tracer_provider = register( space_id = "your-space-id", # in app space settings page api_key = "your-api-key", # in app space settings page project_name = "your-project-name", # name this to whatever you would like ) # Import the automatic instrumentor from OpenInference from openinference.instrumentation.langchain import LangChainInstrumentor # Finish automatic instrumentation LangChainInstrumentor().instrument(tracer_provider=tracer_provider)To test, you can create a simple RAG application using Langchain.
from langchain.chains import RetrievalQA from langchain.retrievers import KNNRetriever from langchain_openai import ChatOpenAI, OpenAIEmbeddings knn_retriever = KNNRetriever( index=np.stack(df["text_vector"]), texts=df["text"].tolist(), embeddings=OpenAIEmbeddings(), ) chain_type = "stuff" # stuff, refine, map_reduce, and map_rerank chat_model_name = "gpt-3.5-turbo" llm = ChatOpenAI(model_name=chat_model_name) chain = RetrievalQA.from_chain_type( llm=llm, chain_type=chain_type, retriever=knn_retriever, metadata={"application_type": "question_answering"}, ) response = chain.invoke("What is Arize and how can it help me as an AI Engineer?") Now start asking questions to your LLM app and watch the traces being collected by Arize.
In this example we will instrument an LLM application built using Groq
pip install openinference-instrumentation-groq groq arize-otelSet up GroqInstrumentor to trace calls to Groq LLM in the application and sends the traces to an Arize model endpoint as defined below.
from openinference.instrumentation.groq import GroqInstrumentor # Import open-telemetry dependencies from arize.otel import register # Setup OTel via our convenience function tracer_provider = register( space_id = "your-space-id", # in app space settings page api_key = "your-api-key", # in app space settings page project_name = "your-project-name", # name this to whatever you would like ) GroqInstrumentor().instrument(tracer_provider=tracer_provider)Run a simple Chat Completion via Groq and see it instrumented
import os from groq import Groq # get your groq api key by visiting https://groq.com/ os.environ["GROQ_API_KEY"] = "your-groq-api-key" client = Groq() # send a request to the groq client chat_completion = client.chat.completions.create( messages=[ { "role": "user", "content": "Explain the importance of low latency LLMs", } ], model="mixtral-8x7b-32768", ) print(chat_completion.choices[0].message.content)4. Run your LLM application
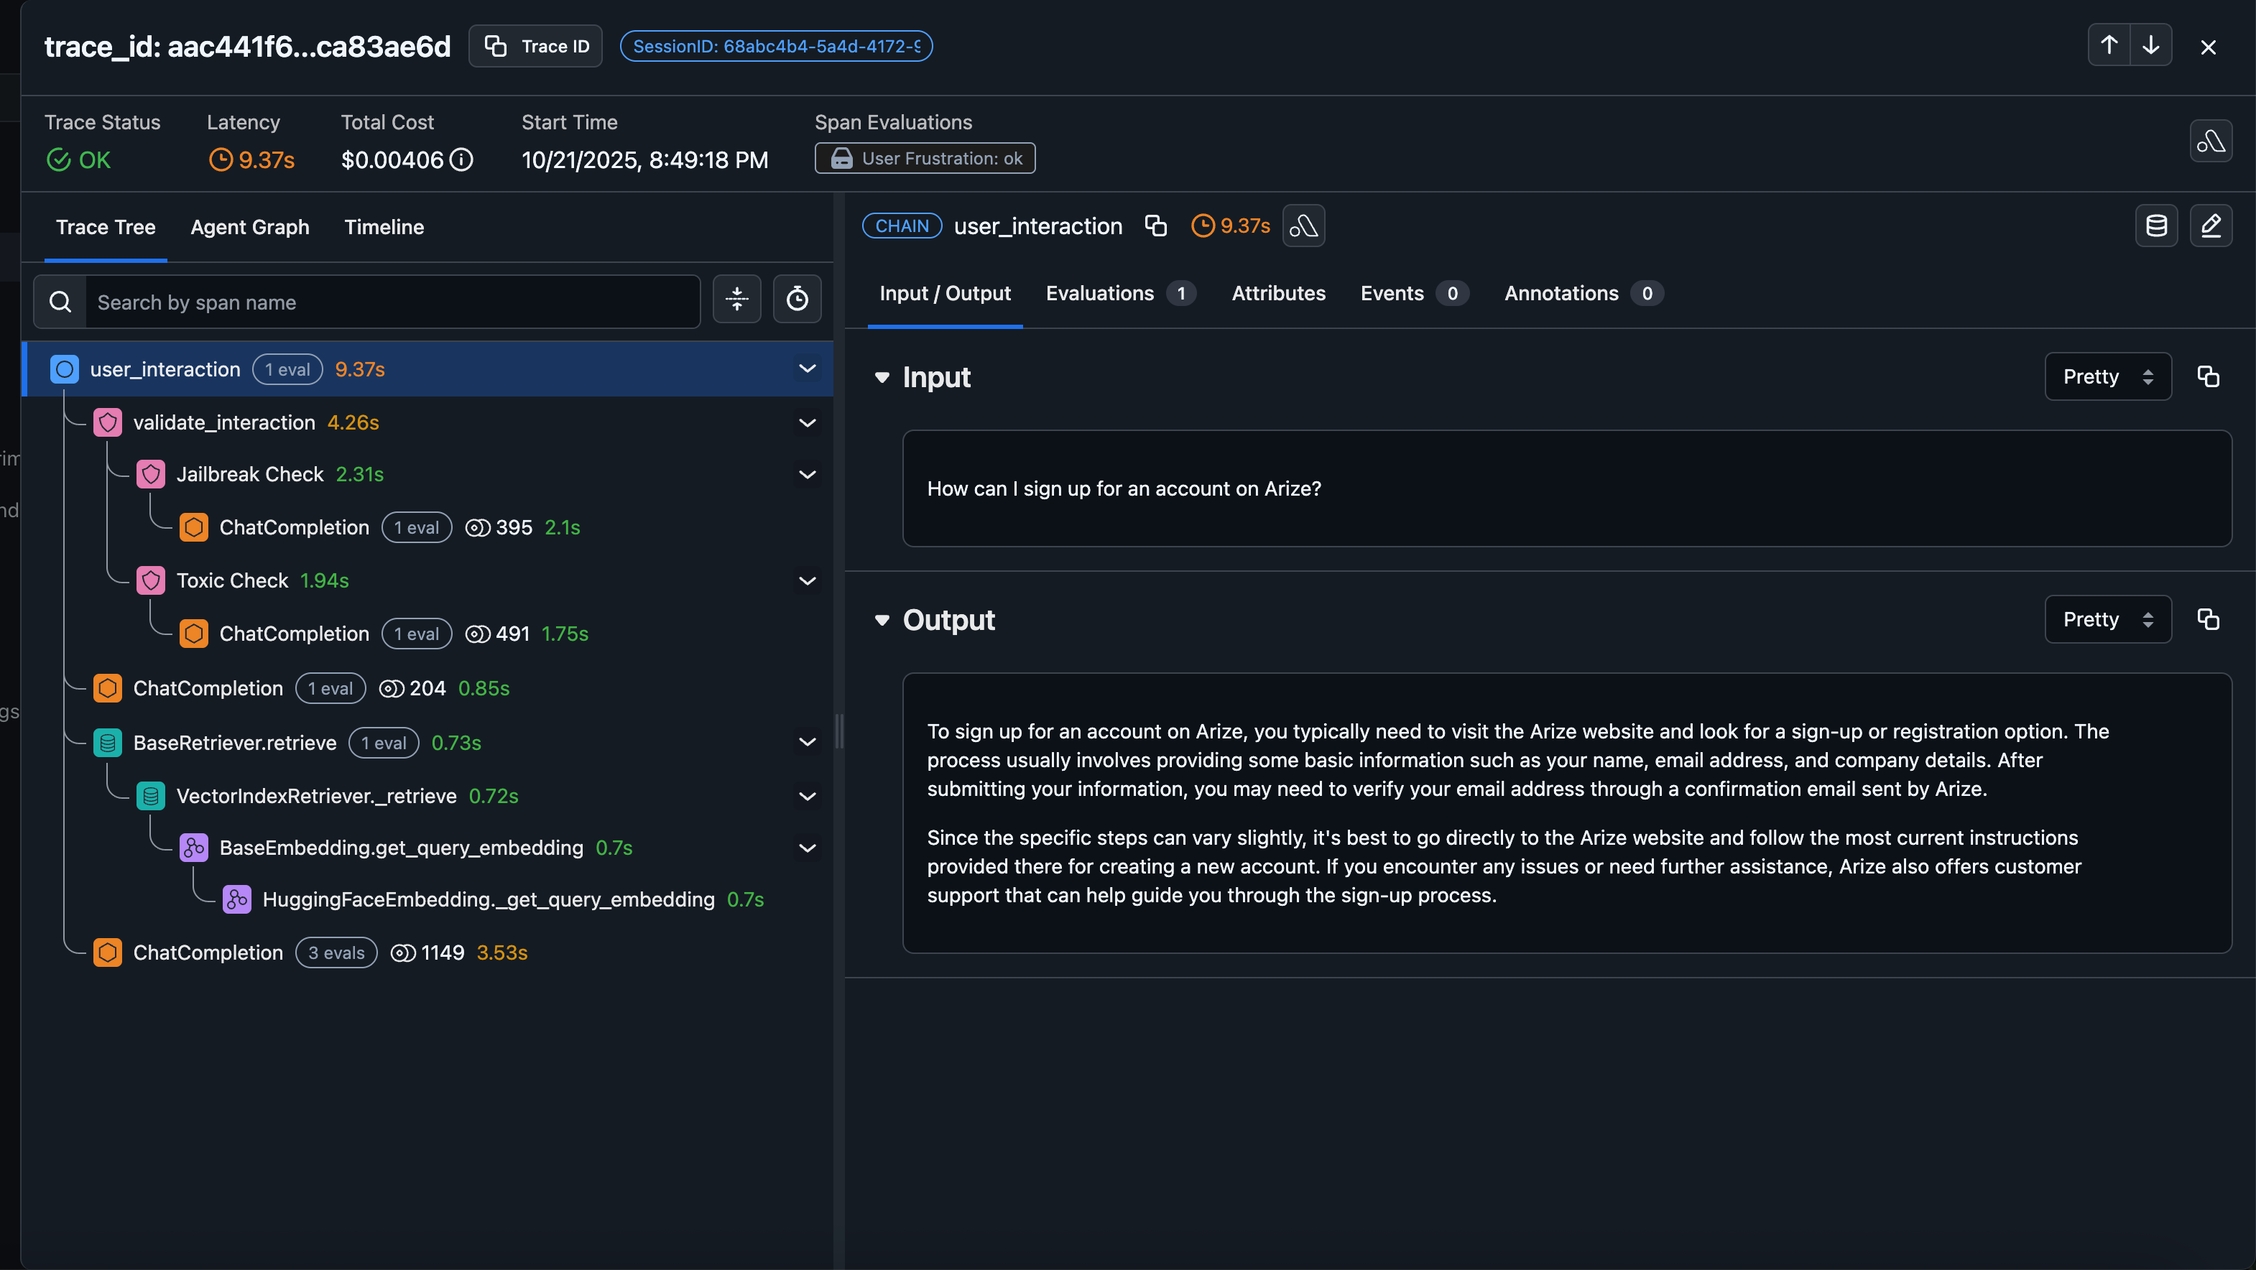
Once you've executed a sufficient number of queries (or chats) to your application, you can view the details on the LLM Tracing page.

To continue with this guide, go to the trace evaluations guide to add evaluation labels to your traces!
Next steps
Dive deeper into the following topics to keep improving your LLM application!
Last updated
Was this helpful?