Learn how to style vector tiles.
You can use OpenLayers to display vector tile data using custom styles. ol-mapbox-style supports the MapLibre style specification, which allows you to customize the fill, outline, opacity, and other properties of vector tiles to display data effectively. If your vector tiles are published from a feature service, you can also perform data-driven visualizations based on attributes of the original feature service.
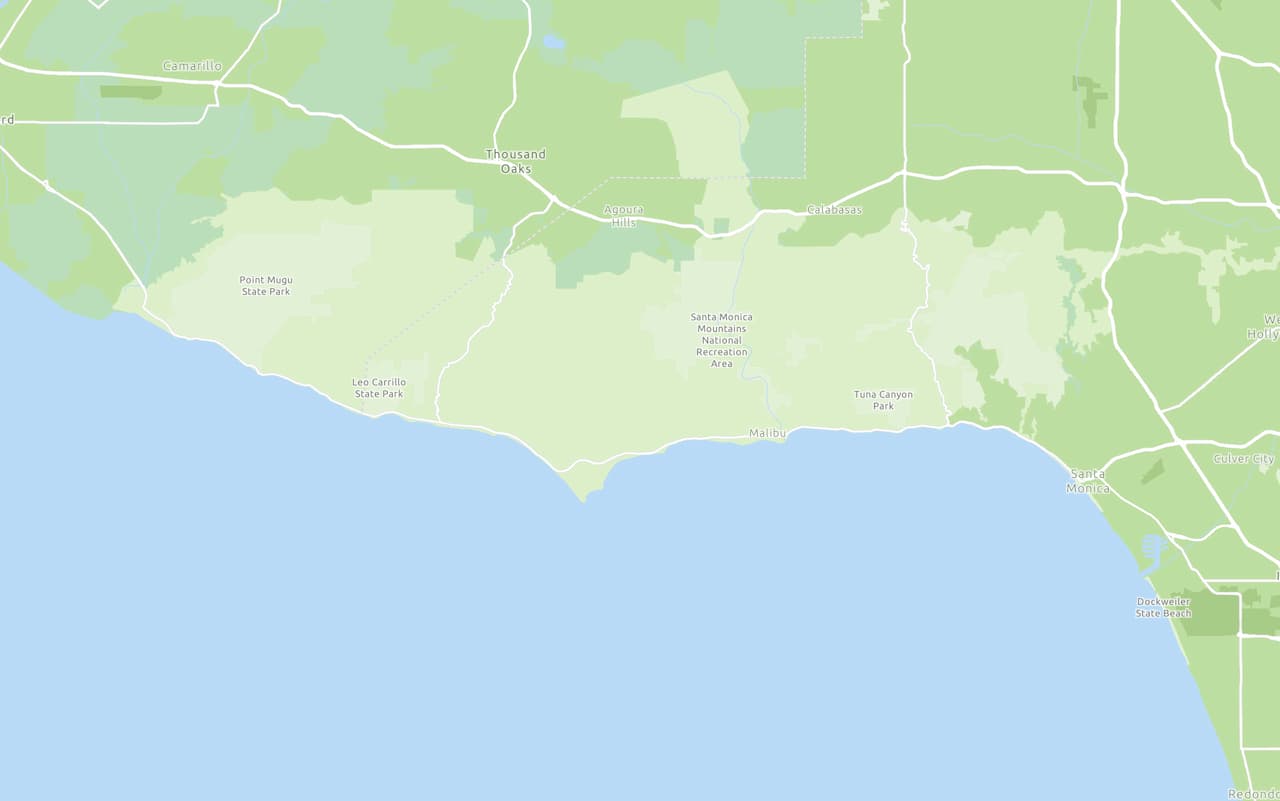
In this tutorial, you style land parcels from a public vector tile service according to their use type.
Prerequisites
You need an ArcGIS Location Platform or ArcGIS Online account.
Steps
Review the source data
This tutorial uses the Santa Monica Mountains Parcels vector tile service. This vector tile service was created by publishing a feature service as vector tiles using the portal. It contains the attributes of the original feature service, which can be accessed to style layers in your application. Find the original feature service in ArcGIS.com to view the names and values of different attributes.
-
Go to the item page for the Santa Monica Mountains Parcels vector tile layer.
-
Under Details, find the Created from property. Follow the link to view the item page for the original feature layer, Santa_Monica_Mountains_Parcels.
-
Click the Data tab to view the layer's features and attributes. Each feature represents a land parcel and has attributes such as an address, use code, and number of square feet.
-
Review the values of the
Usefield. You will use this field to style vector tiles in your application.Type
Get the starter app
Select a type of authentication and follow the steps to create a new app.
Choose API key authentication if you:
- Want the easiest way to get started.
- Want to build public applications that access ArcGIS Location Services and secure items.
- Have an ArcGIS Location Platform or ArcGIS Online account.
Choose user authentication if you:
- Want to build private applications.
- Require application users to sign in with their own ArcGIS account and access resources their behalf.
- Have an ArcGIS Online account.
To learn more about both types of authentication, go to Authentication.
Set up authentication
Set developer credentials
Use the API key or OAuth developer credentials so your application can access ArcGIS services.
Add the vector tile layer
Add a vector tile Source and a vector tile Layer to your application to display data from the Santa Monica Mountains Parcels vector tile service.
-
Create a
Vectorsource using anTile MVTfeature format. Save it to aparcelsvariable.Source Use dark colors for code blocks olms.apply(map, basemapURL).then((map) => { const parcelsSource = new ol.source.VectorTile({ format: new ol.format.MVT(), url: "https://vectortileservices3.arcgis.com/GVgbJbqm8hXASVYi/arcgis/rest/services/Santa_Monica_Mountains_Parcels_VTL/VectorTileServer/tile/{z}/{y}/{x}.pbf", }); -
Add the data attribution for the vector tile layer source.
- Go to the Santa Monica Mountains Parcels item.
- Scroll down to the Acknowledgments section and copy its value.
- Paste the copied value to the
attributionsproperty.Use dark colors for code blocks olms.apply(map, basemapURL).then((map) => { const parcelsSource = new ol.source.VectorTile({ format: new ol.format.MVT(), url: "https://vectortileservices3.arcgis.com/GVgbJbqm8hXASVYi/arcgis/rest/services/Santa_Monica_Mountains_Parcels_VTL/VectorTileServer/tile/{z}/{y}/{x}.pbf", // Attribution text retrieved from https://arcgis.com/home/item.html?id=f0298e881b5b4743bbdf2c7d378acc84 attributions: ["| County of Los Angeles Office of the Assessor"] });
-
Create a
Vectorlayer, referencing theTile parcelssource.Source Use dark colors for code blocks const parcelsSource = new ol.source.VectorTile({ format: new ol.format.MVT(), url: "https://vectortileservices3.arcgis.com/GVgbJbqm8hXASVYi/arcgis/rest/services/Santa_Monica_Mountains_Parcels_VTL/VectorTileServer/tile/{z}/{y}/{x}.pbf", // Attribution text retrieved from https://arcgis.com/home/item.html?id=f0298e881b5b4743bbdf2c7d378acc84 attributions: ["| County of Los Angeles Office of the Assessor"] }); const parcelsLayer = new ol.layer.VectorTile({ source: parcelsSource }); -
Add the layer to the map with
map.add.Layer Use dark colors for code blocks const parcelsLayer = new ol.layer.VectorTile({ source: parcelsSource }); map.addLayer(parcelsLayer);
Create a MapLibre style object
The ol-mapbox-style library will allow you to style data and reference the attributes of vector tiles. Create a MapLibre style object that styles land parcels according to their Use attribute.
-
Create a MapLibre style object and set the root properties. Set
versionto 8 and include a source of typevector. Do not include other source parameters, as you have already created a source using OpenLayers.Use dark colors for code blocks map.addLayer(parcelsLayer); const parcelsStyle = { version: 8, sources: { parcels: { type: "vector" } }, layers: [ ] }; -
Add a
filllayer that references theparcelssource. Setsource-layertoSantato reference the original feature service._Monica _Mountains _Parcels Use dark colors for code blocks const parcelsStyle = { version: 8, sources: { parcels: { type: "vector" } }, layers: [ { "id": "parcels-fill", "source": "parcels", "source-layer": "Santa_Monica_Mountains_Parcels", "type": "fill", }, ] }; -
Add a custom
fill-colorto the layer. Usegetto retrieveUseattribute values, viewed in the previous step. UseType caseto create a conditional expression that assigns a unique color to each use type.Use dark colors for code blocks const parcelsStyle = { version: 8, sources: { parcels: { type: "vector" } }, layers: [ { "id": "parcels-fill", "source": "parcels", "source-layer": "Santa_Monica_Mountains_Parcels", "type": "fill", "paint": { "fill-color": ["case", ["==", ["get", "UseType"], "Residential"], "#E8E191", // Yellow ["==", ["get", "UseType"], "Commercial"], "#E580A2", // Red ["==", ["get", "UseType"], "Government"], "#79E284", // Green ["==", ["get", "UseType"], "Industrial"], "#C080E5", // Purple ["==", ["get", "UseType"], "Institutional"], "#80BBE5", // Blue "#bfbfbf" ] } }, ] };
Add an outline layer
Add a second vector tile layer to the style object to customize the parcel outlines.
-
Add a
linelayer to thelayerslist in the style object. Set the layer ID toparcels-outline, the source toparcels, and thesource-layertoSantato reference the original feature service._Monica _Mountains _Parcels Use dark colors for code blocks const parcelsStyle = { version: 8, sources: { parcels: { type: "vector" } }, layers: [ { "id": "parcels-fill", "source": "parcels", "source-layer": "Santa_Monica_Mountains_Parcels", "type": "fill", "paint": { "fill-color": ["case", ["==", ["get", "UseType"], "Residential"], "#E8E191", // Yellow ["==", ["get", "UseType"], "Commercial"], "#E580A2", // Red ["==", ["get", "UseType"], "Government"], "#79E284", // Green ["==", ["get", "UseType"], "Industrial"], "#C080E5", // Purple ["==", ["get", "UseType"], "Institutional"], "#80BBE5", // Blue "#bfbfbf" ] } }, { "id": "parcels-outline", "source": "parcels", "source-layer": "Santa_Monica_Mountains_Parcels", "type": "line", } ] }; -
Style the color, width, and opacity of the parcel outlines.
Use dark colors for code blocks { "id": "parcels-outline", "source": "parcels", "source-layer": "Santa_Monica_Mountains_Parcels", "type": "line", "paint": { "line-color": "#000000", "line-width": 0.25, "line-opacity": 0.25 } }
Apply the layer style
Use ol-mapbox-style to apply the MapLibre style object to the vector tile layer.
-
Call
olms.applywith the parcels layer and parcels style to customize the vector tiles. SetStyle() updatetoSource falseto preserve the OpenLayers source you provided.Use dark colors for code blocks "paint": { "line-color": "#000000", "line-width": 0.25, "line-opacity": 0.25 } } ] }; olms.applyStyle(parcelsLayer, parcelsStyle, { updateSource: false });
Run the app
Run the app.
You should see the styled vector tile layer with parcels displayed on the basemap layer. Parcels shouold be styled in different colors based on their use type, and thin outlines should be present around each parcel.What's next?
Learn how to use additional location services in these tutorials: