Learn how to execute a SQL query to a feature layer.
A feature layer can contain a large number of features stored in ArcGIS. To access a subset of the features, you can execute a SQL or spatial query, or both at the same time. You can also return the attributes, geometry, or both attributes and geometry for each record. SQL and spatial queries are useful when a feature layer is very large and you just want to access a subset of the data.
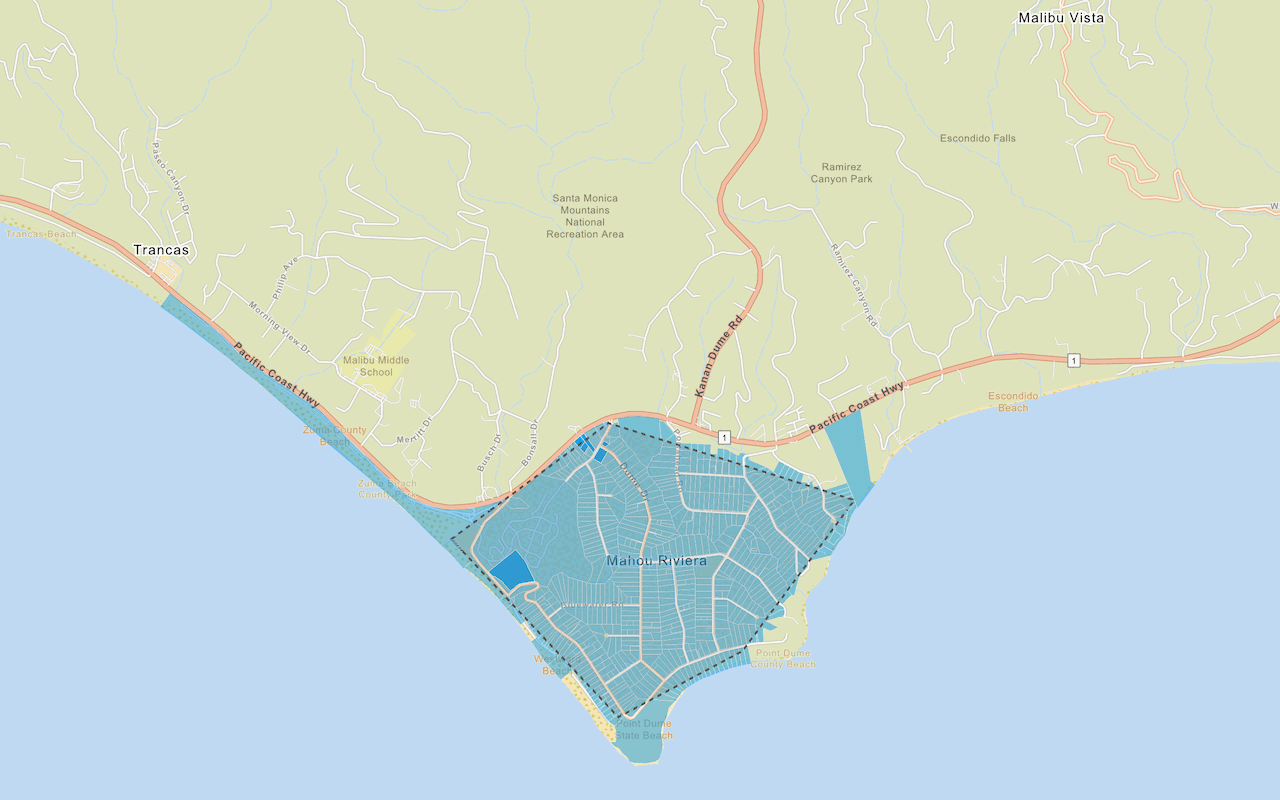
In this tutorial, you perform server-side SQL queries to return a subset of the features from the LA County Parcel hosted feature layer. The feature layer contains over 2.4 million features. The resulting features are displayed as graphics on the map. A pop-up is also used to display feature attributes.
Prerequisites
You need an ArcGIS Location Platform or ArcGIS Online account.
Steps
Get the starter app
Select a type of authentication below and follow the steps to create a new application.
Set up authentication
Create developer credentials in your portal for the type of authentication you selected.
Set developer credentials
Use the API key or OAuth developer credentials so your application can access ArcGIS services.
Add references
This tutorial uses ArcGIS REST JS to query the feature layer, and the ol-popup library to display pop-ups.
-
In the
<headelement, add references to the ArcGIS REST JS and ol-popup libraries.> Use dark colors for code blocks <link rel="stylesheet" href="https://cdn.jsdelivr.net/npm/ol@v10.6.0/ol.css" type="text/css" /> <script src="https://cdn.jsdelivr.net/npm/ol@v10.6.0/dist/ol.js"></script> <script src="https://cdn.jsdelivr.net/npm/ol-mapbox-style@13.1.0/dist/olms.js" type="text/javascript"></script> <script src="https://unpkg.com/@esri/arcgis-rest-request@4/dist/bundled/request.umd.js"></script> <script src="https://unpkg.com/@esri/arcgis-rest-feature-service@4/dist/bundled/feature-service.umd.js"></script> <script src="https://unpkg.com/ol-popup@5.1.1/dist/ol-popup.js"></script> <link rel="stylesheet" href="https://unpkg.com/ol-popup@5.1.1/src/ol-popup.css" />
Create a SQL selector
ArcGIS feature layers support a standard SQL query where clause. Use an HTML select element to provide a list of SQL queries for the LA County Parcel feature layer.
-
Create a
selectelement containing anoptionelement for eachwhereclause.Use dark colors for code blocks <body> <div id="map"></div> <select id="query-select"> <option value="" selected>Choose a WHERE clause...</option> <option value="UseType = 'Residential'">UseType = 'Residential'</option> <option value="UseType = 'Government'">UseType = 'Government'</option> <option value="UseType = 'Irrigated Farm'">UseType = 'Irrigated Farm'</option> <option value="TaxRateArea = 10853">TaxRateArea = 10853</option> <option value="TaxRateArea = 10860">TaxRateArea = 10860</option> <option value="TaxRateArea = 08637">TaxRateArea = 08637</option> <option value="Roll_LandValue > 1000000">Roll_LandValue > 1000000</option> <option value="Roll_LandValue < 1000000">Roll_LandValue < 1000000</option> </select> -
Add styling to position the
selectelement in the top right.Use dark colors for code blocks <style> html, body, #map { padding: 0; margin: 0; height: 100%; width: 100%; font-family: Arial, Helvetica, sans-serif; font-size: 14px; color: #323232; } #query-select { position: absolute; top: 20px; right: 20px; padding: 4px 8px; font-size: 16px; border-radius: 0; /* Causes more uniform appearance across browsers. */ }
Add parcel layer
Parcels returned by the query are simple GeoJSON polygons. You will create a Vector layer to display them.
-
Create a
Vectorlayer and save it to aparcelvariable. Add it to the map withLayer map.add.Layer As you are not passing a
styleparameter, the default styling for polygons will be used. See the OpenLayers documentation for more details.Use dark colors for code blocks const basemapId = "arcgis/navigation"; const basemapURL = `https://basemapstyles-api.arcgis.com/arcgis/rest/services/styles/v2/styles/${basemapId}?token=${accessToken}`; const parcelLayer = new ol.layer.Vector(); olms.apply(map, basemapURL).then((map) => { map.addLayer(parcelLayer); // Add Esri attribution // Learn more in https://esriurl.com/attribution const source = map.getLayers().item(0).getSource(); const poweredByEsriString = "Powered by <a href='https://www.esri.com/en-us/home' target='_blank'>Esri</a> | "; const attributionFn = source.getAttributions(); if (attributionFn) { source.setAttributions((ViewStateLayerStateExtent) => { return [poweredByEsriString, ...attributionFn(ViewStateLayerStateExtent)]; }); } else source.setAttributions(poweredByEsriString); });
Create the query
Use the ArcGIS REST JS query method to find features in the LA County Parcels feature layer that match the selected where clause.
To limit the query results to the visible extent of the Map, you can set the query geometry property. To do so your function will take a geometry object in the required esri format of [minx, miny, maxx, maxy]. This confines the SQL query to the geographic bounds (extent) of the map.
When the matching parcels are returned, create a new Vector source using a Geo feature format, to update your parcels Vector layer.
-
Create a function called
executewithQuery whereandClause geometryparameters. Inside, create a newarcgisto access the feature service. CallRest. Api Key Manager arcgis. Pass theRest.query Features geometryandgeometry. Specify GeoJSON as the return type, requestingType returnand specificGeometry out. All of the features within the geometry will be returned with attribute information set by theFields outproperty.Fields There are many other spatial relationships that you can specify with
spatial. For example, you can useRel esrito only return parcels completely within the viewport. See the ArcGIS services reference for details.Spatial Rel Contains Use dark colors for code blocks map.addLayer(parcelLayer); // Add Esri attribution // Learn more in https://esriurl.com/attribution const source = map.getLayers().item(0).getSource(); const poweredByEsriString = "Powered by <a href='https://www.esri.com/en-us/home' target='_blank'>Esri</a> | "; const attributionFn = source.getAttributions(); if (attributionFn) { source.setAttributions((ViewStateLayerStateExtent) => { return [poweredByEsriString, ...attributionFn(ViewStateLayerStateExtent)]; }); } else source.setAttributions(poweredByEsriString); }); function executeQuery(whereClause, geometry) { arcgisRest .queryFeatures({ url: "https://services3.arcgis.com/GVgbJbqm8hXASVYi/arcgis/rest/services/LA_County_Parcels/FeatureServer/0", geometry: geometry, geometryType: "esriGeometryEnvelope", inSR: 4326, // EPSG:4326 uses latitudes and longitudes spatialRel: "esriSpatialRelIntersects", where: whereClause, f: "geojson", returnGeometry: true, outFields: ["APN", "UseType", "TaxRateCity", " Roll_LandValue"] }) } -
Add a response handler. Inside, create a
Geofeature format. Use it to read features from the response to a newJSON Vectorsource.Use dark colors for code blocks function executeQuery(whereClause, geometry) { arcgisRest .queryFeatures({ url: "https://services3.arcgis.com/GVgbJbqm8hXASVYi/arcgis/rest/services/LA_County_Parcels/FeatureServer/0", geometry: geometry, geometryType: "esriGeometryEnvelope", inSR: 4326, // EPSG:4326 uses latitudes and longitudes spatialRel: "esriSpatialRelIntersects", where: whereClause, f: "geojson", returnGeometry: true, outFields: ["APN", "UseType", "TaxRateCity", " Roll_LandValue"] }) .then((response) => { const geojson = new ol.format.GeoJSON({ defaultDataProjection: "EPSG:4326", featureProjection: "EPSG:3857" }); let newSource = new ol.source.Vector({ features: geojson.readFeatures(response), }); parcelLayer.setSource(newSource); }); } -
Add the data attribution for the feature layer source.
- Go to the LA County Parcels item.
- Scroll down to the Acknowledgments section and copy its value.
- Paste the copied value to the
attributionsproperty.Use dark colors for code blocks function executeQuery(whereClause, geometry) { arcgisRest .queryFeatures({ url: "https://services3.arcgis.com/GVgbJbqm8hXASVYi/arcgis/rest/services/LA_County_Parcels/FeatureServer/0", geometry: geometry, geometryType: "esriGeometryEnvelope", inSR: 4326, // EPSG:4326 uses latitudes and longitudes spatialRel: "esriSpatialRelIntersects", where: whereClause, f: "geojson", returnGeometry: true, outFields: ["APN", "UseType", "TaxRateCity", " Roll_LandValue"] }) .then((response) => { const geojson = new ol.format.GeoJSON({ defaultDataProjection: "EPSG:4326", featureProjection: "EPSG:3857" }); let newSource = new ol.source.Vector({ features: geojson.readFeatures(response), // Attribution text retrieved from https://arcgis.com/home/item.html?id=a6fdf2ee0e454393a53ba32b9838b303 attributions: ['| County of Los Angeles Office of the Assessor'] }); parcelLayer.setSource(newSource); }); }
Execute the query
The execute function needs to execute when you select an option from the select control. You achieve this by adding a change event handler. You can access the chosen where clause with the value property of the select element.
You need to calculate the extent of the current map view in latitude and longitude. You can use View.calculate to get the extent, and proj.transform to convert it to the EPSG:4326 spatial reference.
-
Add a
changeevent handler to theselectelement. Inside, useView.calculateandExtent ol.proj.transformto calculate the viewport extent. CallExtent executewith the extent andQuery whereclause.Use dark colors for code blocks let newSource = new ol.source.Vector({ features: geojson.readFeatures(response), // Attribution text retrieved from https://arcgis.com/home/item.html?id=a6fdf2ee0e454393a53ba32b9838b303 attributions: ['| County of Los Angeles Office of the Assessor'] }); parcelLayer.setSource(newSource); }); } // Listen for changes const select = document.getElementById("query-select"); select.addEventListener("change", () => { const whereClause = select.value; const extent3857 = map.getView().calculateExtent(map.getSize()); const extent4326 = ol.proj.transformExtent(extent3857, "EPSG:3857", "EPSG:4326"); executeQuery(whereClause, extent4326); }); -
At the top right, click Run.
When you select a where clause using the select control, a query will run against the feature layer and display all land parcels within the current viewport matching the where clause.
Add a pop-up
The parcels returned from the query contain many attributes, such as land value and land use type. You can make the parcels interactive by showing a pop-up when the user clicks on a parcel. You create a Popup to display parcel attributes. It is a type of Overlay so you add it to the map with map.add.
-
Create a
Popupand save it to apopupvariable. Add it to the map withmap.add.Overlay Use dark colors for code blocks const extent3857 = map.getView().calculateExtent(map.getSize()); const extent4326 = ol.proj.transformExtent(extent3857, "EPSG:3857", "EPSG:4326"); executeQuery(whereClause, extent4326); }); const popup = new Popup(); map.addOverlay(popup); -
Create a map
clickevent handler. Inside, usemap.getto get the clicked parcel, if any. If there is one, useFeatures At Pixel popup.showto display a pop-up containing the parcel's APN, use type, land value and taxation city.Use dark colors for code blocks const popup = new Popup(); map.addOverlay(popup); map.on("click", (event) => { const parcel = map.getFeaturesAtPixel(event.pixel, { layerFilter: (l) => l === parcelLayer // don't query layers from the basemap })[0]; if (parcel) { const message = `<b>Parcel ${parcel.get("APN")}</b>` + `<br>Type: ${parcel.get("UseType")} <br>` + `Land value: ${parcel.get("Roll_LandValue")} <br>` + `Tax Rate City: ${parcel.get("TaxRateCity")}`; popup.show(event.coordinate, message); } else { popup.hide(); }
Run the app
Run the app.
When the map displays, you should be able to use the query selector to display parcels. Click on a parcel to show a pop-up with the feature's attributes.What's next?
Learn how to use additional location services in these tutorials:
Query a feature layer (spatial)
Execute a spatial query to access polygon features from a feature service.

Get global data
Query demographic information for locations around the world.

Get local data
Query regional facts and spending trends for a study area in the United States.
Add a feature layer as GeoJSON
Display and style GeoJSON features from a feature service.

Style a feature layer
Use data-driven styling to apply symbol colors and styles to feature layers.