Learn how to find and extract features with the Map Viewer, ArcGIS APIs, and the spatial analysis service.
Find analyses allow you to find feature data with a SQL or spatial query or to export feature data to create new feature data.
In this tutorial, you use the Find Existing Locations and Derive New Locations operations to determine which neighborhood areas have more vacant housing to live in within a quarter of a mile of high schools in San Francisco. You can perform the combine analyses either in Map Viewer or programmatically using the ArcGIS Python, ArcGIS REST JS, and ArcGIS REST APIs.
The analyses include:
- Finding high schools within San Francisco (excluding Treasure Island and Yerba Buena Island).
- Finding neighborhoods within a quarter mile (~.4 km) of a high school.
- Identifying the census blocks within neighborhoods closest to a high school.
- Styling the census blocks to identify the blocks with most vacant housing.
After performing the analyses, you will export the results to a KML file.
Prerequisites
Steps
Copy the web map
The tutorial web map contains predefined layers to use as the starting point for the analyses outlined in the steps below.
-
Go to the Find and extract data tutorial web map and click Sign in.
-
Verify that you have the following layers by toggling the visibility on and off:
- Schools
- Neighborhoods
- Census blocks with housing data
-
Click Save > Save As > Save Map to save a copy.
Create a feature layer with high schools
The Schools hosted feature layer contains 445 schools in San Francisco, including independent, private, and public schools. Use the Find Existing Locations operation to return only high schools (grades 9-12) in San Francisco.
-
In the Settings (light) toolbar, click Analysis > Tools > Find by Attributes and Location.
-
Click + Build new query > Attribute Expression > Next.
-
Add the following parameters:
- Find features from: Schools
- Where: All of the following are true
- Category
- equals
USD Grades 9-12
-
Click Add.
-
Set the Output name to:
San Francisco High Schools. -
Click Estimate credits. The estimated cost for ArcGIS Location Platform is USD $.04 and ArcGIS Online is .445 credits.
-
Click Run.
-
When the analysis completes, Select the San Francisco High Schools layer > Show table to see the features returned.
-
Implement authentication with the following privileges:
- Spatial Analysis > Feature Analysis
-
Define the parameters.
-
Perform the operation.
Note: This is a long transaction managed with a job request.
-
Handle the results.
APIs
from arcgis.gis import GIS from arcgis.features.analysis import find_existing_locations portal = GIS(username="<USERNAME>", password="<PASSWORD>") sf_schools = "https://services3.arcgis.com/GVgbJbqm8hXASVYi/arcgis/rest/services/San_Francisco_Schools/FeatureServer/0" results = find_existing_locations( input_layers=[sf_schools], expressions=[ {"operator": "", "layer": 0, "where": "Category = 'USD Grades 9-12'"} ], context={ "extent": { "xmin": -13647972.49107637, "ymin": 4536058.802455983, "xmax": -13611053.406414682, "ymax": 4559486.751625358, "spatialReference": {"wkid": 102100, "latestWkid": 3857}, } }, ) result_features = results.query() print( f"There are {len(result_features.features)} high schools.", ) map_widget = portal.map() map_widget.add_layer(result_features) map_widget.zoom_to_layer(result_features) map_widget Service requests
Request
POST arcgis.com/sharing/rest/portals/self HTTP/1.1 Content-Type: application/x-www-form-urlencoded &f=json &token=<ACCESS_TOKEN>Response (JSON)
{ "helperServices": { // Other parameters "analysis": { "url": "https://{YOUR_ANALYSIS_SERVICE}/arcgis/rest/services/tasks/GPServer" } } } { "helperServices":{ // Other parameters "analysis": { "url": "https://{YOUR_ANALYSIS_SERVICE}/{WEBADAPTOR_NAME}/rest/services/System/SpatialAnalysisTools/GPServer"}, } }The results contain high schools in the San Francisco area.
Derive new neighborhood areas near a high school
The Neighborhoods hosted feature layer contains the boundaries for 92 neighborhoods in San Francisco. To find the areas within a neighborhood that are closest to the high schools found in the previous analysis, use the Derive New Locations operation.
Construct the spatial query
- In the Settings (light) toolbar, click Analysis > Tools > Find by Attributes and Location.
- Click + Build new query > Spatial expression > Next to create the following query:
- **Find features from **: Neighborhoods
- Where: All of the following are true
- Click + Spatial expression
- within a distance of:
.25Miles - of San Francisco High Schools
- Click Add
- Set Include only the parts of features the meet the criteria to
true. - Set the Output name to:
Neighborhood portions near high schools. - Click Estimate credits. The estimated cost for ArcGIS Location Platform is USD $0.01 and ArcGIS Online is 0.11 credits.
- Click Run to create the new layer.
Style neighborhoods
To differentiate between the neighborhoods, style Neighborhood portions near high schools with a unique symbol.
-
Select the Neighborhood portions near high schools layer and click Style in the Settings (light) toolbar.
-
Click + Field > and select the
nbrhoodfield then click Add. -
Click Style options under Types (Unique symbols) style.
-
In Style options, click the ellipsis next to the Other style and choose move up.
-
Click Done twice to close the styles pane.
The neighborhoods should all have unique colors.
-
Implement authentication with the following privileges:
- Spatial Analysis > Feature Analysis
-
Define the parameters.
-
Perform the operation.
Note: This is a long transaction managed with a job request.
-
Handle the results.
APIs
from arcgis.gis import GIS from arcgis.features.analysis import derive_new_locations portal = GIS(username="<USERNAME>", password="<PASSWORD>") highschools = "https://services3.arcgis.com/GVgbJbqm8hXASVYi/arcgis/rest/services/San_Francisco_High_Schools/FeatureServer/0" neighborhoods = "https://services3.arcgis.com/GVgbJbqm8hXASVYi/arcgis/rest/services/SF_Neighborhoods/FeatureServer/0" results = derive_new_locations( input_layers=[neighborhoods, highschools], expressions=[ { "operator": "", "layer": 0, "selectingLayer": 1, "spatialRel": "withinDistance", "distance": 0.25, "units": "Miles", } ], ) result_features = results.query() print( f"There are {len(result_features.features)} neighborhood sections.", ) map_widget = portal.map() map_widget.add_layer(result_features) map_widget.zoom_to_layer(result_features) map_widget Service requests
Request
POST arcgis.com/sharing/rest/portals/self HTTP/1.1 Content-Type: application/x-www-form-urlencoded &f=json &token=<ACCESS_TOKEN>Response (JSON)
{ "helperServices": { // Other parameters "analysis": { "url": "https://{YOUR_ANALYSIS_SERVICE}/arcgis/rest/services/tasks/GPServer" } } } { "helperServices":{ // Other parameters "analysis": { "url": "https://{YOUR_ANALYSIS_SERVICE}/{WEBADAPTOR_NAME}/rest/services/System/SpatialAnalysisTools/GPServer"}, } }Style the layer
To learn how to style a feature layer, go to Visualization.
{ "renderer": { "visualVariables": [ { "type": "sizeInfo", "target": "outline", "expression": "view.scale", "valueExpression": "$view.scale", "stops": [ { The resulting layer contains neighborhoods within a .25 mile buffer of the schools.
Find census blocks completely within neighborhood portions
Census blocks are statistical areas bounded by roads, property lines, and other features. In cities, they can correspond to city blocks. The Census blocks with housing data hosted feature layer contains 7,823 features with attribute information about the total number of vacant housing units per block. Use the Derive New Locations tool to find which census blocks are completely within the .25 mile buffer of neighborhood sections.
Construct the spatial query
-
In the Settings (light) toolbar, click Analysis.
-
In the panel, click Find Locations > Find by Attributes and Location.
-
Click + Build new query > Spatial expression > Next.
-
In the Query builder set the following parameters:
- Find features from: Census blocks with housing data
- Where: All of the following are true
- Click + Spatial expression >
- Completely within
- Neighborhood portions near high schools
-
Click Add
-
Set Include only the parts of features that meet the criteria to
true(checked). -
Set the Output name:
Census blocks within neighborhood portions. -
Click Estimate credits. The estimated cost for ArcGIS Location Platform is USD $0.78 and ArcGIS Online is 7.86 credits.
-
Click Run to create the new layer.
Style the resulting layer
The Census blocks within neighborhood portions layer contains attributes, such as the total number of rentals, owner-occupied housing, and total units available. Style the feature layer to visualize the amount of housing units available per census block.
-
Ensure the Census blocks within neighborhood portions layer is selected then click Styles in the Settings (light) toolbar.
-
Click + Field then select the 2020 Vacant Housing Units field and click Add.
-
Select Counts and Amounts (color) > Style Options and click the pencil next to Symbol style.
-
Under Colors choose a yellow to red color ramp.
-
Click Done > Done to close the style pane.
-
In the Contents (dark) toolbar, click Save and open > Save to save your web map.
-
Implement authentication with the following privileges:
- Spatial Analysis > Feature Analysis
-
Define the parameters.
-
Perform the operation.
Note: This is a long transaction managed with a job request.
-
Handle the results.
APIs
from arcgis.gis import GIS from arcgis.features.analysis import find_existing_locations portal = GIS(username="<USERNAME>", password="<PASSWORD>") census_blocks = "https://services3.arcgis.com/GVgbJbqm8hXASVYi/arcgis/rest/services/Census_blocks_with_housing_data/FeatureServer/0" neighborhood_sections = "https://services3.arcgis.com/GVgbJbqm8hXASVYi/arcgis/rest/services/Neighborhood_portions_near_high_schools/FeatureServer/0" results = find_existing_locations( input_layers=[census_blocks, neighborhood_sections], expressions=[ { "operator": "", "layer": 0, "selectingLayer": 1, "spatialRel": "within" } ], context={ "extent": { "xmin": -13647972.49107637, "ymin": 4536058.802455983, "xmax": -13611053.406414682, "ymax": 4559486.751625358, "spatialReference": {"wkid": 102100, "latestWkid": 3857}, } }, ) result_features = results.query() print( f"There are {len(result_features.features)} census blocks.", ) map_widget = portal.map() map_widget.add_layer(result_features) map_widget.zoom_to_layer(result_features) map_widget Service requests
Request
POST arcgis.com/sharing/rest/portals/self HTTP/1.1 Content-Type: application/x-www-form-urlencoded &f=json &token=<ACCESS_TOKEN>Response (JSON)
{ "helperServices": { // Other parameters "analysis": { "url": "https://{YOUR_ANALYSIS_SERVICE}/arcgis/rest/services/tasks/GPServer" } } } { "helperServices":{ // Other parameters "analysis": { "url": "https://{YOUR_ANALYSIS_SERVICE}/{WEBADAPTOR_NAME}/rest/services/System/SpatialAnalysisTools/GPServer"}, } }Style the layer
To learn how to style a feature layer, go to Visualization.
{ "renderer": { "visualVariables": [ { "type": "colorInfo", "field": "VACANT_CY", "valueExpression": null, "stops": [ { "value": 0, The resulting layer should look something like this
Export as KML
You can use the Extract Data operation to export your own or a shared layer, if the owner of the layer has enabled exporting. You can export a layer into formats such as: CSV, File Geodatabase, Shapefile, and KML. Use the operation to export the Derived census blocks hosted feature layer as a KML file.
-
In the Settings (light) toolbar, click Analysis > Tools > Extract Data.
-
Set the following:
- Input layers: Census blocks within neighborhood portions.
- Extent area: Census blocks within neighborhood portions.
-
Select KML from the dropdown under Output data format.
-
Set Output name to:
Extract census blocks. -
Click Estimate credits. The estimated cost for ArcGIS Location Platform is USD $0.02 and ArcGIS Online is 0.23 credits.
-
Click Run.
-
Locate the saved KML file in your folder.
-
Click the Extract census blocks file.
-
On the right of the Overview page, click Download.
-
Implement authentication with the following privileges:
- Spatial Analysis > Feature Analysis
-
Define the parameters.
-
Perform the operation.
Note: This is a long transaction managed with a job request.
-
Handle the results.
APIs
from arcgis import GIS from arcgis.features.analysis import extract_data portal = GIS(username="<USERNAME>", password="<PASSWORD>") census_blocks_within_neighborhoods = "https://services3.arcgis.com/GVgbJbqm8hXASVYi/arcgis/rest/services/census_blocks_completely_within_neighborhood_portions/FeatureServer/0" results = extract_data( input_layers=[census_blocks_within_neighborhoods], extent=neighborhoods, clip=False, data_format="KML", output_name={"title": "<ITEM_NAME>"} ) print(f"The new item ID is: {results.itemid}")Service requests
Request
POST arcgis.com/sharing/rest/portals/self HTTP/1.1 Content-Type: application/x-www-form-urlencoded &f=json &token=<ACCESS_TOKEN>Response (JSON)
{ "helperServices": { // Other parameters "analysis": { "url": "https://{YOUR_ANALYSIS_SERVICE}/arcgis/rest/services/tasks/GPServer" } } } { "helperServices":{ // Other parameters "analysis": { "url": "https://{YOUR_ANALYSIS_SERVICE}/{WEBADAPTOR_NAME}/rest/services/System/SpatialAnalysisTools/GPServer"}, } }Go to the folder in which you saved the file to verify that it is there.

Display the KML file in Google Earth
To support interoperability between different services, you can extract and convert data to different formats. KML files can be used in a Google Earth project. Upload the KML file to Google Earth to see the census blocks from the exported file.
-
Go to Google Earth.
-
In the left panel click New > Local KML file.
-
Click Import and browse to the file you downloaded in the previous step.
You will be zoomed in to San Francisco and see the census blocks that were exported from the Census blocks within neighborhood portions. However, you will not see the layer styles that were applied earlier.

What's next?
You performed a series of find analyses to identify the areas of census blocks that have vacant housing units near a high school. Your web map should look something like this.
Learn how to use additional tools, APIs, and location services in these tutorials:
Summarize data
Aggregate and summarize features using summarize analysis operations.
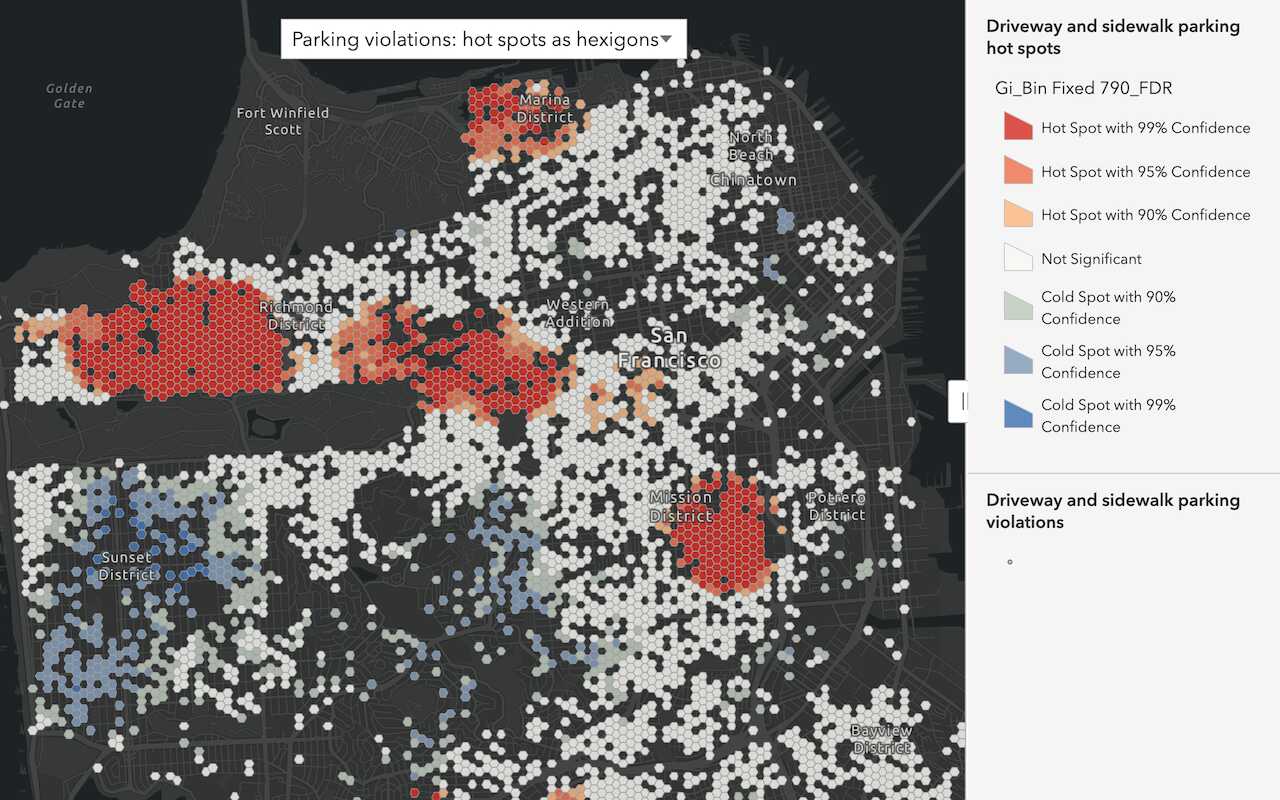
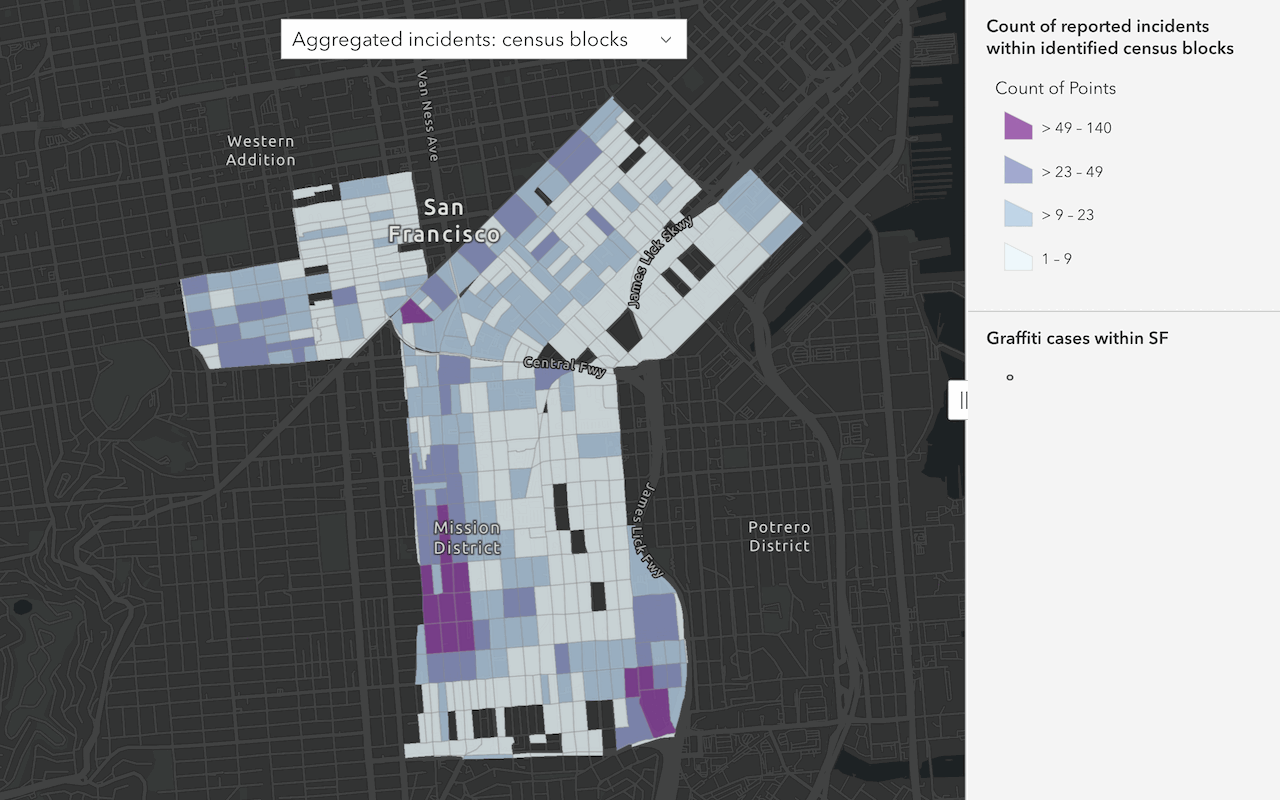
Discover patterns in data
Find patterns and trends in data using spatial analysis operations.

Combine data
Overlay, join, and dissolve features using combine analysis operations.