In this workflow, you will learn how to create, manage, and access a vector tile service in your portal, and then build an application to access and display the vector tiles.
Prerequisites
You need an account for ArcGIS Location Platform, ArcGIS Online, or ArcGIS Enterprise to create hosted data services. If you need an account, go to Get started.
Steps
Download the data
For this workflow, you will use the Santa Monica Parcels dataset.
-
In your web browser, go to the Santa Monica Parcels item.
-
Click the Download button to download the zip file locally. Do not unzip this file.
Create a feature layer
Before you create a vector tile layer, you need to create a feature layer.
To create a feature layer in a feature service, you need to upload data into ArcGIS. You can use data management tools or scripting APIs.
Data management tools
Import the shapefile using a data management tool.
In your web browser, go to https://location.arcgis.com, and sign in with your ArcGIS Location Platform account. In the ArcGIS Location Platform dashboard, click My portal to go to your portal.
-
In the top navigation bar, click Content.
-
Click New item. To upload the Santa Monica Parcels shapefile, you can either:
- Drag and drop the file.
- Or, click Your device and navigate to the file path.
-
Select Add Santa Monica Parcels.zip to publish the file as a hosted feature layer.
-
Set the following information in the item details pane:
- Title:
Santa Monica Parcels - Tags:
Santa MonicaParcels. - Summary:
Parcels in the Santa Monica Mountains.
- Title:
-
Click Next to create the new feature layer and feature service.
Scripting APIs
You can also import the shapefile with the ArcGIS API for Python or ArcGIS REST JS. The general steps are as follows:
- Import the required libraries.
- Implement authentication.
- Create and publish a portal item.
- Handle the results.
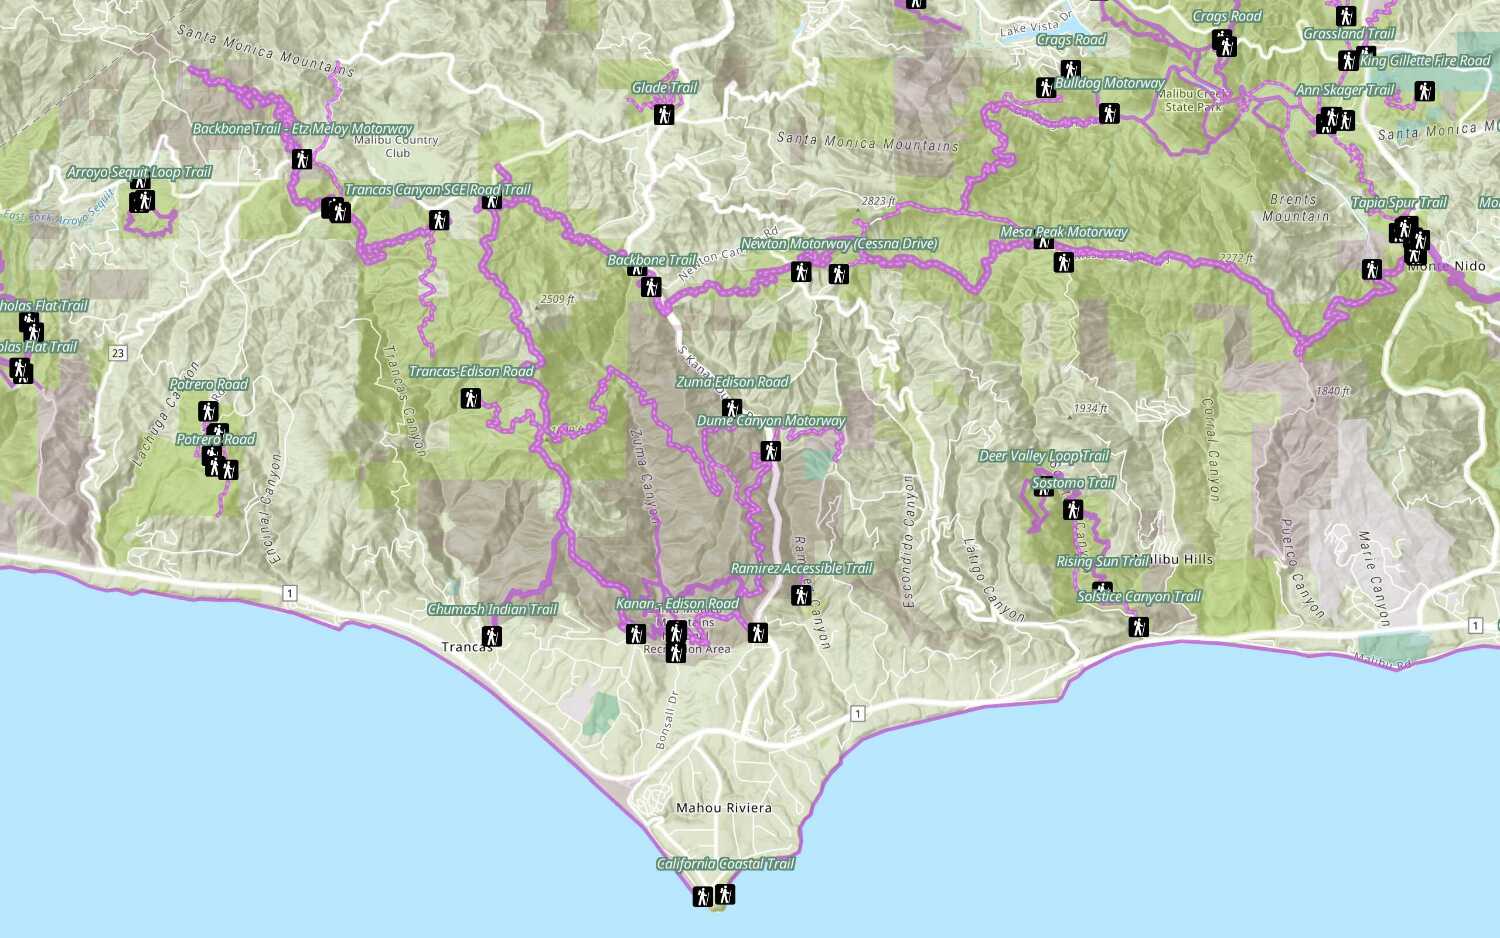
# local path to shapefile zip file input_file_path = str( Path(__file__).parent / "Santa_Monica_Public_Parcels.zip" ) # add the zip file as an item to portal shp_item = portal.content.add( { "title": "Santa Monica Public Parcels", "description": "Santa Monica public parcels", "tags": "Santa, Monica, public, parcels", "type": "Shapefile", }, input_file_path, ) # publish the item to create a hosted featurelayer shp_service = shp_item.publish(None) print(f"New item id : {shp_service.id, }, url: {shp_service.layers[0].url}")The feature layer will look something like this:

Set the feature style
The parcels data contains a number of useful attributes. The default style is set to display all features using a single color. To make the feature layer style more meaningful, use a unique value renderer to render each parcel base on its usetype attribute value.
Data management tools
Use data management tools to style the parcel features.
In ArcGIS portal, use the Visualization tab to set the feature styles.
-
Go back to the item page > Visualization.
-
In the left panel, click the Layers and select the Santa Monica parcels layer. In the right panel, click Styles.
-
Click + Field, and add
usetype. -
Under Pick a style, select Types (unique symbols) and click Style options.
-
Click on the symbol next to each of the use type values to update the symbol color.
-
Set each of the
usetypevalues to the following properties:- Fill Color:
- Residential:
#ffde3e - Commercial:
#c29ed7 - Industrial:
#004c73 - Government:
#fc921f - Institutional:
#149ece - Recreational:
#267300 - Miscellaneous:
#b7814a
- Residential:

- Fill Color:
-
Click the X to exit out of Symbol style.
-
Click the pencil icon next to symbol style. Set the following properties for all the use types:
- Fill transparency:
30% - Outline color:
#ffffff - Outline transparency:
65% - Outline width:
1 - Adjust width automatically: false

- Fill transparency:
-
Click the X to exit out of Symbol style. Then click Done twice.
-
Click Save to save the style in the feature layer item.
Scripting APIs
You can also style features using ArcGIS scripting APIs. The general steps are as follows:
- Import relevant libraries.
- Implement authentication.
- Retrieve feature layer properties.
- Define a new renderer.
- Update feature layer properties.
- Handle results.
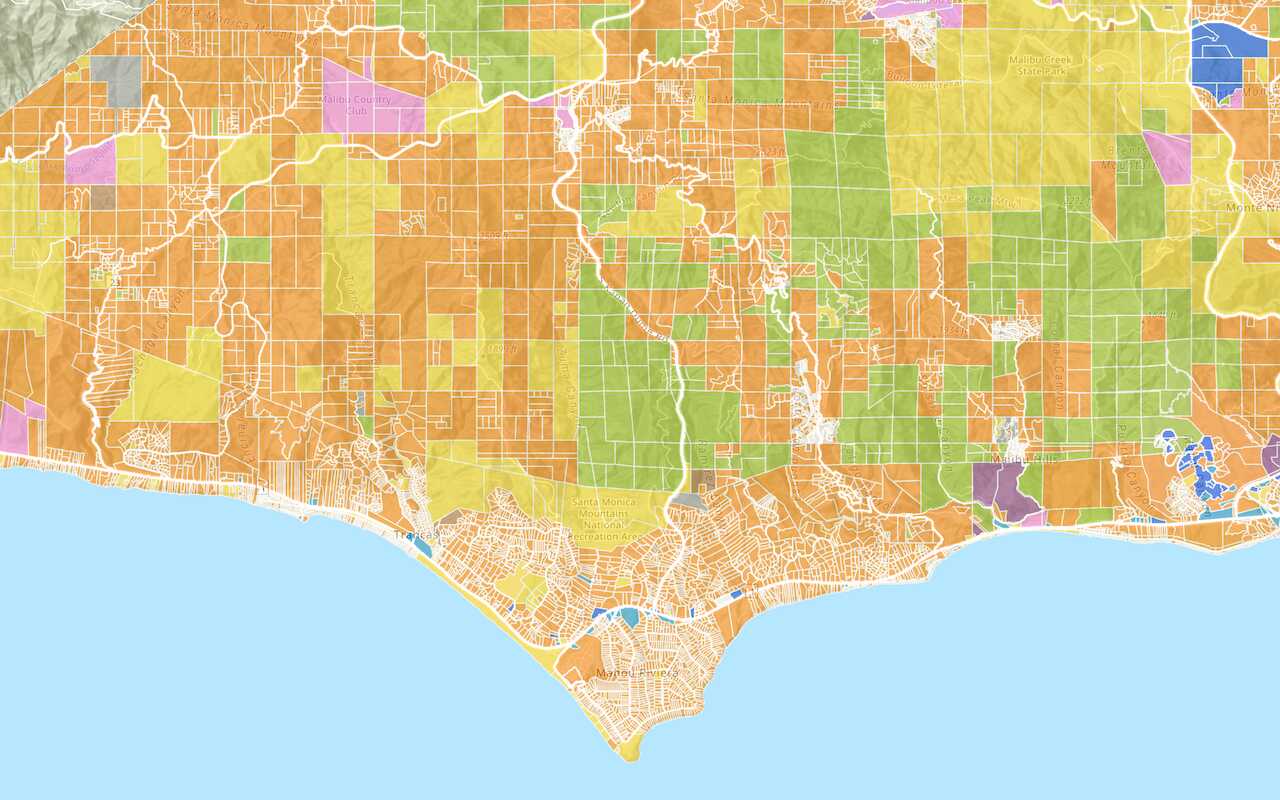
# update the drawing info feature_layer_props["drawingInfo"] = new_drawing_info # reset last edit date feature_layer_props["editingInfo"]["lastEditDate"] = None # apply changes results = feature_layer.manager.update_definition(feature_layer_props) print(results)The styled layer will look something like this:

Manage the service settings
The layer has a large amount of polygon features and vertices. For optimal performance and to conserve service resources, you should configure the service to support optimized layer drawing, spatial indexes, and longer CDN caching.
In the item page, click the Settings tab.
Enable the following settings:
-
Optimize layer drawing
- In the item page, go to the Settings > Optimize Layer Drawing. Click Optimize layers and select the layer to optimize > Update.
-
Cache control
- In the item page, go to the Settings tab > Cache control. Set the time you want users to wait before seeing updates to the layer.
Publish the vector tile service
To publish a vector tile service from a source feature service, you can use data management tools or scripting APIs.
Data management tools
- Sign into your portal.
- Go to the item page of the source feature layer.
- Click Publish > Vector Tile layer.
- For the Tiling scheme, select ArcGIS Online basemaps. Click Next.
- Set the following information in the item details pane:
- Title:
Santa Monica parcels (vector tile) - Tags:
santa,monica,parcels,vector,tile,service - Click Save.
- Title:
Scripting APIs
- Import libraries.
- Reference feature layer.
- Define publish parameters.
- Execute publish operation.
- Handle results.
vector_tile_service = item.publish( publish_parameters=vector_tile_params, output_type="vectorTiles", file_type="featureService", build_initial_cache=False, ) print( f"New item created:\n\tid:{vector_tile_service.id}\n\turl: {vector_tile_service.url}" )Manage vector tile service settings
You can add attributes to be included in the tile cache and also rebuild the cache when the features in the source feature layer have been updated. When the features in the source feature layer have been updated, it's good practice to refresh the vector tile cache so that the latest data is included.
In the item page, use the Settings tab to configure cache settings.
-
Add attributes to the tile cache
- In the item page, click on the Settings tab.
- Under Settings, scroll down to Configure attributes.
- Click on Select attributes. In the Select Attributes dialog, select the following fields:
situsfulla,usetype,usedescrip.
-
Rebuild tile cache
- In the item page, click on the Settings tab.
- Under Settings, scroll down to Manage Vector Tile Layer Cache.
- Click Rebuild Cache.
Get an access token
By default, the sharing level of an item is set to Owner and requires an access token, such as an API key to access it in a client-side application. If you have an ArcGIS Location Platform or ArcGIS Online account, you can scope an API key to access private items. You cannot scope an API key to access private items if you have an ArcGIS Enterprise account. Instead, to access private items, you need to generate a token from an OAuth 2.0 workflow.
In your web browser, go to https://location.arcgis.com, and sign in with your ArcGIS Location Platform account. In the ArcGIS Location Platform dashboard, click My portal to go to your portal.
- Click Content > My Content.
- Click the New Item > Developer credentials.
- In the Create developer credentials window, select API key credentials. Click Next.
- Set an expiration date for your API key. API keys can be valid for up to one year. Then, click Next.
- In the Privileges menu, check the following privileges:
- Location services > Basemaps
- In the Grant item access menu, click Browse items.
- Select the tile layer item you just created. Then, click Next.
- Fill out the following properties:
- Title:
API key - Data services workflow - Tags:
authentication,data,hosting,workflow,portal - Summary: API key used to provide authentication for data hosting workflows.
- Title:
- Click Next.
- Review your selections and, when you are ready, click Next.
- Click Generate the API key and go to item details page. I am ready to copy and save the key.
- Click Next.
- Copy the API key and store it safely. You will not be able to view it again later. If you lose it, you will have to generate another key.
Find the URL, item ID and style definition
To access a hosted layer from an application, you need to be able to identify its ID and URL or item ID. If a layer is public, you use the URL or item ID to access it directly with your web browser or any application. If the layer is private, you need to provide an access token.
If you are using an ArcGIS Maps SDK, Esri Leaflet, or the MapLibre ArcGIS plugin:
- In the item page, click View to access the vector tile service. Locate the Service ItemId, which will look something like this:
- Service ItemId: c4fc087b100542fe91df0b279df23ef9
If you are using open source libraries such as OpenLayers or CesiumJS:
-
In the item page, scroll down to the bottom of the page to find the URL. For example:
- URL:
https://vectortileservices3.arcgis.com/ G Vgb Jbqm8h XASV Yi/arcgis/rest/services/ Santa _Monica _parcels _(vector _tiles)/ Vector Tile Server
- URL:
-
Go back to the item page. To view the style, click View style. The style will look something like this:
Use dark colors for code blocks Copy { "version": 8, "sprite": "../sprites/sprite", "glyphs": "../fonts/{fontstack}/{range}.pbf", "sources": { "Santa_Monica_parcels_(vector_tiles)": { "type": "vector", "bounds": [-118.517, 33.9954, -118.444, 34.0504], "minzoom": 0, "maxzoom": 23, "scheme": "xyz", "url": "../../" } }, "layers": [ { "id": "Santa_Monica_public_parcels/Residential", "type": "fill", "source": "Santa_Monica_parcels_(vector_tiles)", "source-layer": "Santa_Monica_public_parcels", "filter": ["==", "_symbol", 0], "layout": {}, "paint": { "fill-color": "rgba(255,222,62,0.7)", "fill-outline-color": "rgba(255,255,255,0.25)"
With the vector tile layer published, you can now access the layer either using the {z}/{y}/{x}.pbf or root.json paths.
Display vector tiles
-
Select an ArcGIS Maps SDK or open source library.
-
In the layer item page, find the item ID or the URL and layer index.
-
In the code, set the access token and either the item ID or the URL.
-
Add the layer to the map.
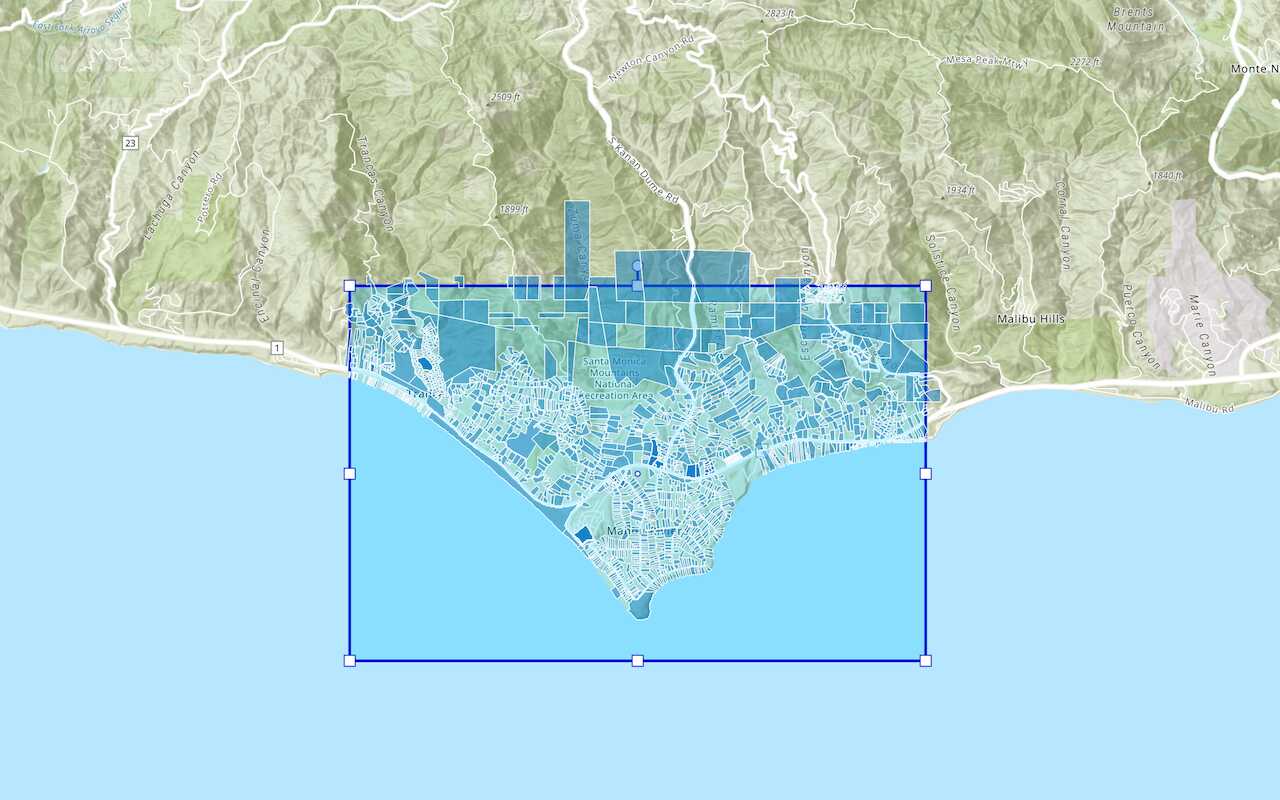
const portal = new Portal({ url: "https://www.arcgis.com/", authMode: "immediate", }) // OR esriConfig.apiKey = "YOUR_ACCESS_TOKEN" // Scoped to access the item below const parcelsLayer = new VectorTileLayer({ portalItem: { id: "b8f6941ceb874d72a7c37418c3e8108d", }, opacity: 0.75, }) const map = new Map({ basemap: "arcgis/light-gray", layers: [parcelsLayer], }) Your app will look something like this:
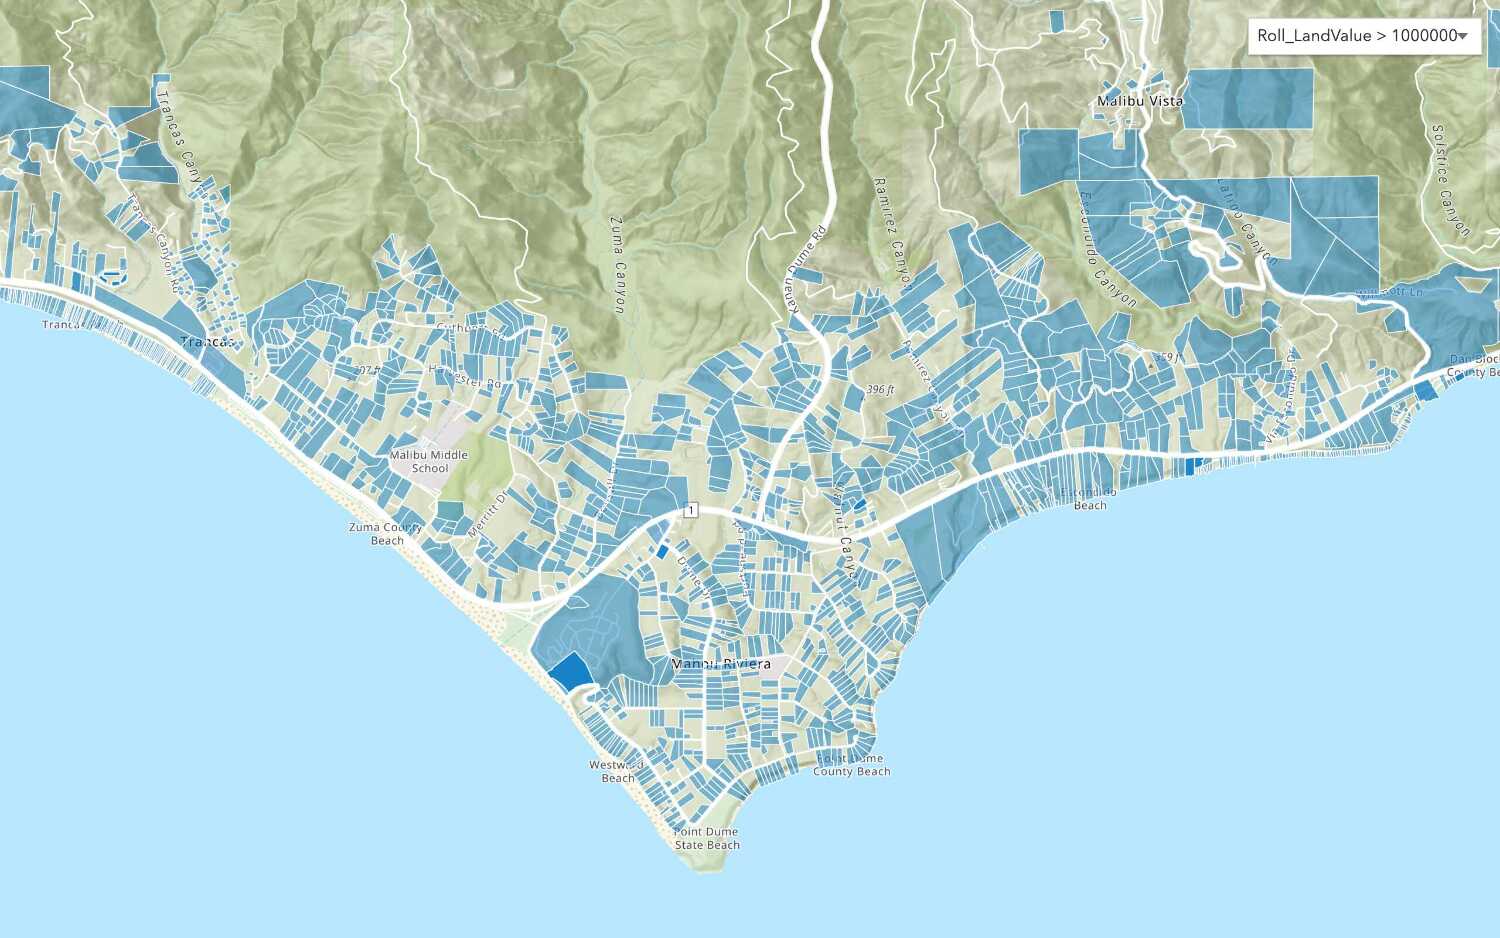
Display attributes
If you use MapLibre GL JS you can view the attributes by querying the tile service using the URL.
map.on("mousemove", "parcels-fill", e => { map.getCanvas().style.cursor = "pointer" const feature = e.features[0] popup .setLngLat(e.lngLat) .setHTML(`<b>Address:</b> ${feature.properties.situsfulla}</br><b>Use type:</b> ${feature.properties.usetype} </br><b>Use Description:</b> ${feature.properties.usedescrip}`) .addTo(map) }) What's next?
Learn how to use additional tools, APIs, and location services in these tutorials:

Import data to create a feature layer
Use data management tools to import files and create a feature layer in a feature service.
Define a new feature layer
Use data management tools to define and create a new empty feature layer in a feature service.

Manage a feature layer
Use a hosted feature layer item to set the properties and settings of a feature layer in a feature service.

Create a vector tile service
Use data management tools to create a new vector tile service from a feature service.

Create a map tile service
Use ArcGIS Online or scripting APIs to publish a map tile service.