
Get Started With Fixed Layout Reports
Introduction
A fixed layout report is the unique feature of ActiveReportsJS that allows you to control report items' location and dimension with unparalleled accuracy. You can use a fixed layout to replicate pre-printed forms and bind them to the data. The output of such reports is a completed form that you can view in a browser, print, or export to one of the supported formats and share the export output with interested parties. Examples of fixed-layout reports are Purchase Orders, Quotes, Parking Tickets, and others.
In this tutorial, we build the data-bound Invoice Form from the ground up, providing experience with the typical report designing process. By the end, you will be able to do the following:
Create a Fixed Layout Report
Bind the report to the OData API with multiple endpoints
Use the OData $select and $filter query options to reduce the volume of retrieved data
Create
cascading report parametersfor interaction with a report readerUse the OData $expand query option to create nested data sets
Configure data binding of the fixed layout
Use Image report item to display an embedded image
Use TextBox report item to display textual information
Configure a fixed table layout to display data in accordance to a pre-printed form layout
Display summary fields in the table footer
Upon completion of all tutorial steps, the final report will look like this: live demo.
Prerequisites
The following content assumes that you have the Standalone Report Designer running. Visit the tutorial for detailed information. A stable internet connection is also required to access the Demo Data Hub.
Creating a New Report
In the standalone report designer, click the File menu and select the Fixed Page Layout template for a newly created report. Click anywhere on the gray area around the report layout to load the report properties in the Properties panel. In the Margins section, set the Style property to Narrow to change the report page margins size.
Expand to watch creating a new report in action
Data Binding
Data Binding establishes a connection between a report and the data it displays. In this tutorial, we use the MESCIUS Demo OData API that replicates the well-known Northwind database. It contains the sales data for a fictitious company called Northwind Traders, which imports and exports specialty foods worldwide.
Adding Data Source
You can think of the Northwind OData API as the "database" that you can connect to using its root URL https://demodata.mescius.io/northwind/odata/v1, and that contains multiple "tables" which presented with endpoints such as /Products, /Customers, and /Orders. You can create a Report DataSource that establishes the connection to such a "database" using the following steps.
Open the Data panel of the property inspector and click the
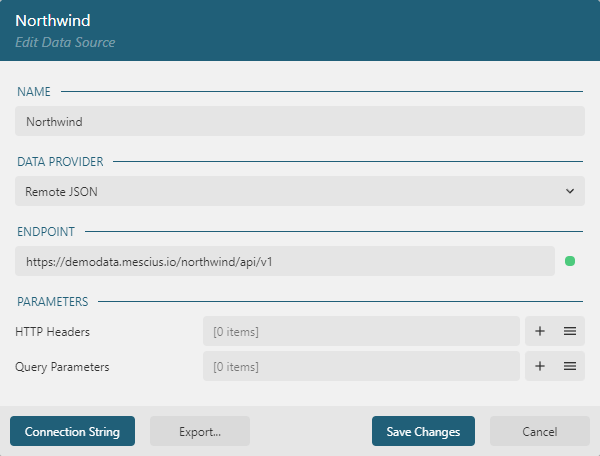
Addbutton.In the Data Source editor dialog, type
Northwindin the NAME field andhttps://demodata.mescius.io/northwind/odata/v1in the ENDPOINT field.Click the
Save Changesbutton
Adding Supplemental Data Sets
Data Sets represent one or more endpoints of the Data Source. For the Invoice Form report, we need to have access to the data from the /Orders, /Customers and /Products endpoints of the Northwind Data Source that we added in the previous section. First, we add supplemental data sets that we will use to build the cascading parameters user interaction and to resolve the relationships between different data sets.
Use the following steps to add the Customers data set:
Click the
+icon nearNorthwindin the Data panel.In the Data Set Editor dialog, type
Customersin the NAME field,/Customersin the Uri/Path field, and$.value.*in theJson Pathfield.By default, each
Customerrecord includes 11 fields, but we don't need them all. Therefore we limit the retrieved fields by applying the OData $select query option via aquery parameterClick the
+icon on the right side of theParameterssection.Type
$selectin theParameterfield of the newly addedParameteritem.Type
CustomerId, CompanyName, Address, City, PostalCode, Countryin theValuefield of the sameParameteritem.
Click the
Validatebutton.Ensure that the
DataBase Fieldssection displays[6 items]text.Click the
Save Changesbutton.
Expand to watch adding the data set in action
Next, add the Products data set using the same approach:
Click the
+icon nearNorthwindin the Data panel.In the Data Set Editor dialog, type
Productsin the NAME field,/Productsin the Uri/Path field, and$.value.*in theJson Pathfield.By default, each
Productrecord includes ten fields, but we don't need them all. Therefore we limit the retrieved fields by applying the OData $select query option via aquery parameterClick the
+icon on the right side of theParameterssection.Type
$selectin theParameterfield of the newly addedParameteritem.Type
ProductId, ProductNamein theValuefield of the sameParameteritem.
Click the
Validatebutton.Ensure that the
DataBase Fieldssection displays[2 items]text.Click the
Save Changesbutton.
Adding Report Parameter
The Invoice Form that we are building should ask a reader to select a customer and an order and show the invoice for this selection. Using report parameters is the primary method for such user input. Follow the next steps to create the Customer report parameter.
In the Data panel click the
Addbutton in theParametersSection.Type
Customerin theNamefield andSelect Customerin thePromptfield.In the
Available Valuessection selectCustomersfor theData Set Name,CustomerIdfor theValue Field, andCompanyNamefor theLabel Field.
Expand to watch adding the report parameter in action
Configuring Cascading Parameters
The Customer parameter we introduced pulls the list of available values from the Customers data set. Similarly, the Order parameter we are about to introduce should pull the list of available values from the OrderIds data set that is filtered to include orders for the selected customer only:
Click the
+icon nearNorthwindin the Data panel.In the Data Set Editor dialog, type
OrderIdsin the NAME field,/Ordersin the Uri/Path field, and$.value.*in theJson Pathfield.By default, each
Ordersrecord includes 15 fields, but we don't need them all. Therefore we limit the retrieved fields by applying the OData $select query option via the query parameter.Click the
+icon on the right side of theParameterssection.Type
$selectin theParameterfield of the newly addedParameteritem.Type
orderIdin theValuefield of the sameParameteritem.
By default, the
Ordersdata set includes all the orders, but we need to apply the filter according to the selected customer. Therefore we filter the retrieved data using the OData $filter query option via the query parameter. The filter value is bound to the report parameter that we added in the previous step.Click the
+icon on the right side of theParameterssection.Type
$filterin theParameterfield of the newly addedParameteritem.Type
CustomerId+eq+'{@Customer}'in theValuefield of the sameParameteritem.
Click the
Validatebutton.In the Parameter Prompt that appears, type
ALFKIin the@Customerfield and click theSave & Runbutton.Ensure that the
DataBase Fieldssection displays[1 items]text.Click the
Save Changesbutton.
Next, add the Order parameter:
In the Data panel click the
Addbutton in theParametersSection.Type
Orderin theNamefield andSelect Orderin thePromptfield.Select
Integerin theData Typedrop-down.In the
Available Valuessection selectOrderIdsfor theData Set Name,OrderIdfor theValue Field, andOrderIdfor theLabel Field.
You can preview the report output and notice that the Parameters panel appears and asks to select a Customer from the list of pre-determined values. When you choose the customer, their orders display in the available list of the Order parameter drop-down. This flow is what we call Cascading parameters. You can create multiple dependent parameters this way.
Adding Main Data Set
Next, we will add the Orders data set containing the actual data that the report will visualize.
Go back to the report design and exit the Parameter Editor by clicking the Left Arrow icon near the
EDIT PARAMETERheader.Click the
+icon nearNorthwindin the Data panel.In the Data Set Editor dialog, type
Ordersin the NAME field,/Ordersin the Uri/Path field, and$.value.*in the Json Path field.By default, the
Ordersdata set includes data for all the orders, but the report should only display the selected order's data. Therefore we filter the retrieved data by using the OData $filter query option via the query parameter. The filter value is bound to theOrderreport parameter that we added in the previous step.Click the
+icon on the right side of theParameterssection.Type
$filterin theParameterfield of the newly addedParameteritem.Type
OrderId+eq+{@Order}in theValuefield of the sameParameteritem.
Each order contains multiple order details that we can pull by using the $expand query option:
Click the
+icon on the right side of theParameterssection.Type
$expandin theParameterfield of the newly addedParameteritem.Type
OrderDetailsin theValuefield of the sameParameteritem.
Click the
Validatebutton.In the Parameter Prompt that appears, type
10248in the@Orderfield and click theSave & Runbutton.Ensure that the
DataBase Fieldssection displays[15 items]text.Note that the
Nested DataSetsshows theOrderDetailsitem. You can click it to review the nested data set configuration. It should contain five fields.Click the
Save Changesbutton.
Fixed Layout Data Binding
The main difference between the continous layout and the fixed layout is that the former is driven by data-bound regions, and the latter is bound to the data on the root level and controls data region layouts. Thus, we establish the data binding for the fixed layout:
Switch to the Properties panel in the Property Inspector
Click anywhere on the gray area around the report layout
In the
Datasection, select theOrdersitem in theData Set Namedrop-downIn the
Groupsection, expand theGroup Expressionseditor using theListicon on the right side.Click the
Add ItembuttonClick the gray box on the right side of the newly added item and choose the
OrderIdelement in the drop-down menu.
Displaying Invoice Header
The Invoice header should include the company name, logo, order date, order id, and title. We will add the textual information first.
Expand the toolbox using the
Hamburgermenu located on the toolbar's left side.Drag and drop the TextBox item from the toolbox to the report page's top-left corner.
Set the following properties for the newly added textbox in the properties panel. It will display the company name.
Property | Value |
|---|---|
Value | Northwind Traders |
Text Color | #3da7a8 |
Font Size | 22pt |
Font Weight | Bold |
Vertical Align | Middle |
Left | 0in |
Top | 0in |
Width | 5in |
Height | 0.5in |
Padding | 6pt 2pt 6pt 2pt |
Expand to watch adding the Company Name textbox and setting some of its properties in action
In the same manner, add the following text boxes.
Property | Order Date textbox | Order Id textbox | Title textbox |
|---|---|---|---|
Value | {OrderDate} | Order Id : {OrderId} | Invoice |
Text Color | #3c3c3c | #3c3c3c | #3c3c3c |
Font Size | Leave as default | Leave as default | 24pt |
Font Weight | Bold | Bold | Bold |
Vertical Align | Middle | Middle | Middle |
Left | 0in | 0in | 0in |
Top | 0.7in | 1in | 1.5in |
Width | 2in | 2in | 7.5in |
Height | 0.3in | 0.3in | 0.5in |
Padding | 6pt 2pt 6pt 2pt | 6pt 2pt 6pt 2pt | 6pt 2pt 6pt 2pt |
You can now preview the report output, select a customer, their order, click the Preview button and notice that the page displays the selected order id, date, along with company name and title.
Embedding Image
Now, let's add the company logo, but first, we need to embed an image in the report definition. Save the image below to a folder of your choice on your machine(Right-click the image and select the Save Image as item in the context menu)
![]()
Go back to the report design and click anywhere on the gray area around the report layout.
In the
Layoutsection of the Properties panel, click thelisticon on the right side of theEmbedded Imagesproperty.In the
Open Filedialog, select the downloaded image and click theOpenbutton.
Expand to watch embedding the image in action
Displaying image
The embedded image is now part of the report and preserved within the report file. We can use it to display the company logo:
Expand the toolbox using the
Hamburgermenu located on the toolbar's left side.Drag and drop the Image item from the toolbox to the report page's top-right corner.
In the
Appearancesection of the Properties panel, expand theImage Editorusing the icon on the right side.Select
Embeddedin theSourcedrop-down,Northwind-Logoin theValuedrop-down, andimage/pngin theMIME Typedrop-down.Set other properties for the newly added image as per the following table.
Property | Value |
|---|---|
ImageSizing | FitProportional |
HorizontalAlignment | Center |
VerticalAlignment | Middle |
Left | 6in |
Top | 0in |
Width | 1.5in |
Height | 1.5in |
Displaying Invoice Addresses
The Invoice should display billing and shipping addresses. We will add several textboxes to show this information, but let's start with the customer's company name. The Orders data set includes the CustomerId field, but not the CompanyName. We will use the Lookup function to resolve the company name by customer id:
Expand the toolbox using the
Hamburgermenu located on the toolbar's left side.Drag and drop the TextBox item from the toolbox to the report page's top-left corner.
Set the following properties for the newly added textbox in the properties panel.
Property | Value |
|---|---|
Value | {Lookup(CustomerId, CustomerID, CompanyName, "Customers")} |
Text Color | #3c3c3c |
Vertical Align | Middle |
Left | 0in |
Top | 2.6in |
Width | 3.4in |
Height | 0.3in |
Padding | 6pt 2pt 6pt 2pt |
The Lookup function takes the value of the first argument in the current scope - the CustomerId of the order - finds the row with the same CustomerId value in the Customers data set and returns the corresponding CompanyName value.
You can now preview the report output, select a customer and an order, click the Preview button and notice that the page displays the chosen company name.
Go back to the report design and add the rest of the text boxes for the Bill to address and set their properties as per the following table.
Note: to set the bottom border style, expand the Border Style editor using the icon on its right side and set the value marked with the arrow down icon.
Property | Header textbox | Address textbox | City and Zipcode textbox | Country textbox |
|---|---|---|---|---|
Value | BILL TO | {Lookup(CustomerId, CustomerID, Address, "Customers")} | {Lookup(CustomerId, CustomerID, City, "Customers")} {Lookup(CustomerId, CustomerID, PostalCode, "Customers")} | {Lookup(CustomerId, CustomerID, Country, "Customers")} |
Border Width | 0.25pt | Leave as default | Leave as default | Leave as default |
Bottom Border Style | Solid | Leave as default | Leave as default | Leave as default |
Border Color | Gainsboro | Leave as default | Leave as default | Leave as default |
Text Color | #3da7a8 | #3c3c3c | #3c3c3c | #3c3c3c |
Font Size | 12pt | Leave as default | Leave as default | Leave as default |
Font Weight | Bold | Leave as default | Leave as default | Leave as default |
Vertical Align | Middle | Middle | Middle | Middle |
Left | 0in | 0in | 0in | 0in |
Top | 2.2in | 2.9in | 3.2in | 3.5in |
Width | 3.4in | 3.4in | 3.4in | 3.4in |
Height | 0.4in | 0.3in | 0.3in | 0.3in |
Padding | 6pt 2pt 6pt 2pt | 6pt 2pt 6pt 2pt | 6pt 2pt 6pt 2pt | 6pt 2pt 6pt 2pt |
In the same manner, add textboxes for the Ship To address:
Property | Header textbox | Ship Name textbox | Ship Address textbox | Ship City and Zipcode textbox | Ship country textbox |
|---|---|---|---|---|---|
Value | SHIP TO | {ShipName} | {ShipAddress} | {ShipCity} {ShipPostalCode} | {ShipCountry} |
Border Width | 0.25pt | Leave as default | Leave as default | Leave as default | Leave as default |
Bottom Border Style | Solid | Leave as default | Leave as default | Leave as default | Leave as default |
Border Color | Gainsboro | Leave as default | Leave as default | Leave as default | Leave as default |
Text Color | #3da7a8 | #3c3c3c | #3c3c3c | #3c3c3c | #3c3c3c |
Font Size | 12pt | Leave as default | Leave as default | Leave as default | Leave as default |
Font Weight | Bold | Leave as default | Leave as default | Leave as default | Leave as default |
Vertical Align | Middle | Middle | Middle | Middle | Middle |
Left | 3.8in | 3.8in | 3.8in | 3.8in | 3.8in |
Top | 2.2in | 2.6in | 2.9in | 3.2in | 3.5in |
Width | 3.7in | 3.7in | 3.7in | 3.7in | 3.7in |
Height | 0.4in | 0.3in | 0.3in | 0.3in | 0.3in |
Padding | 6pt 2pt 6pt 2pt | 6pt 2pt 6pt 2pt | 6pt 2pt 6pt 2pt | 6pt 2pt 6pt 2pt | 6pt 2pt 6pt 2pt |
You can now preview the report output, select a customer and an order, click the Preview button and notice that the page displays billing and shipping addresses of the specified order. In most cases, these addresses are the same, but there are some orders where these addresses differ. Try to find them.
Adding Fixed Table
The Orders data set contains the nested OrderDetails data set. We will use the fixed table layout to print the order details:
Expand the toolbox using the
Hamburgermenu located on the toolbar's left side.Drag and drop the Table item from the toolbox to any place in the middle of the report page.
Set the following properties for the newly added table in the properties panel.
Property | Value |
|---|---|
DataSet Name | OrderDetails |
Left | 0in |
Top | 4in |
Width | 7.5in |
Fixed Height | 5.5in |
Fixed Height sets the limit for the table's space on the page. If there is more data than the fixed table height can accommodate, they are printed on the new page according to the fixed layout configuration, but we will get to this topic later.
By default, the newly added table has the header, the footer, and the detail rows. We add extra rows into a table footer to accommodate summary values:
Click anywhere inside the table so that it displays the columns and rows handlers
Right-click the last row handler, go to the
Rowmenu itemIncrease the counter on the right side of the
Insert Row/Belowitem and then click on it to add two rows.
Expand to watch adding extra table footer rows in action
Formatting Table Columns
The table we are building should display the Product Name in the first column, the Quantity in the second column, the Unit Price in the third column, and the Total in the 4th column. Based on this information, let's set up columns width:
Click anywhere inside the table so that it displays the columns and rows handlers
Click the first column handler and set its
Widthto1.2inin the Properties panelRepeat the step above for the second and third columns
Right-click the first column handler and select the
Column > Insert Column Leftitem in the context menuClick the newly added column handler and set its
Widthto3.9inin the Properties panel
Expand to watch adding the new column and setting its width in action
Switch to the TEXTBOX tab in the Properties panel. You can now modify the properties of all the table cells of a selected column. Use the following map to configure text appearance of the table columns:
Property | 1st column | 2nd column | 3rd column | 4th column |
|---|---|---|---|---|
Border Width | 0.25pt | 0.25pt | 0.25pt | 0.25pt |
Border Style | Solid | Solid | Solid | #Solid |
Border Color | #e6e6e6 | #e6e6e6 | #e6e6e6 | e6e6e6 |
Text Align | Left | Right | Right | Right |
Vertical Align | Middle | Middle | Middle | Middle |
Format | Leave as default | Leave as default | c2 | c2 |
Padding | 6pt 2pt 6pt 2pt | 6pt 2pt 6pt 2pt | 6pt 2pt 6pt 2pt | 6pt 2pt 6pt 2pt |
Formatting Table Rows
In the same manner, by clicking row handlers and modifying their properties in the ROW and TEXTBOX tabs of the Properties panel, configure the rows appearance:
Property | 1st row | 2nd row | 3rd row | 4th row | 5th row |
|---|---|---|---|---|---|
Height | 0.4in | 0.3in | 0.3in | 0.3in | 0.3in |
Background Color | #f7f7f7 | Leave as Default | #f9f9f9 | #f9f9f9 | #f9f9f9 |
Text Color | #3da7a8 | Leave as Default | Leave as Default | Leave as Default | Leave as Default |
Font Weight | Bold | Leave as Default | Bold | Bold | Bold |
Displaying tables data
It's time to show order details in the table. Fill the table cells according to the scheme below. You can double-click on a table cell and type a value or paste a copied one.
1st column | 2nd column | 3rd column | 4th column | |
|---|---|---|---|---|
1st row | DESCRIPTION | QTY | UNIT PRICE | TOTAL |
2nd row | {Lookup(ProductId, ProductId, ProductName, "Products")} | {Quantity} | {UnitPrice} | {Quantity * UnitPrice} |
3rd row | SUBTOTAL | {Sum(Quantity * UnitPrice)} | ||
4th row | DISCOUNT | {Sum(Quantity * UnitPrice * Discount)} | ||
5th row | BALANCE DUE | {Sum(Quantity * UnitPrice * (1 - Discount))} |
Preview the report output, select the Rattlesnake Canyon Grocery company and order 11077, click the Preview button and notice that the order details data split between two pages because the table has the fixed height that we set at design time earlier.
Adding Overflow Placeholder
When the order details are split among multiple pages, it might be desirable not to print the invoice header on all these pages. It only needs to be shown on the first page of the invoice. To configure this feature, we use the Fixed Layout Overflow.
Go back to the report design and click the
ADD PAGEbutton on the design surface's bottom-right corner.Expand the toolbox using the
Hamburgermenu located on the toolbar's left side.Drag and drop the
Overflow Placeholderitem from the toolbox to the top-right corner of the report page.Make sure that the
LeftandTopproperties of the overflow placeholder are set to0inSwitch to the
Page 1using thefixed page tabsClick anywhere inside the order details table so that it displays the root handler
Click the table handler to load the table in the Properties panel and set its
OverflowNameproperty toOverflowPlaceHolder1that is the name of the newly added overflow placeholder. Also, set theRepeat Blank Rowsproperty toFillPage.
Expand to watch setting the overflow placeholder in action
Preview the report output, select the Rattlesnake Canyon Grocery company and order 11077, click the Preview button and notice that the order details data split between two pages, but the second page only displays the order details that didn't fit into the first page along with summary values. The overflow placeholder has the same height as the table does, and the Repeat Blank Rows property allows putting empty lines to fill the entire available space. If the order details data do not fit on the second page, then the third page will be generated to print the overflow.
The final version of the report is available at the demo web-site.