
JVM 诊断工具进阶使用指南:jcmd、jmap、async-profiler 实战
Java虚拟机(JVM)是Java应用程序运行的基础,随着应用复杂度的增加,性能问题和内存泄漏等问题变得越来越常见。掌握JVM诊断工具的使用技巧对于Java开发者和运维工程师来说至关重要。本文将深入探讨jcmd、jmap、async-profiler等JVM诊断工具的进阶使用方法,并结合实际案例展示如何有效诊断和解决JVM相关问题。
JVM诊断工具概览
JVM提供了丰富的诊断工具,这些工具可以帮助我们深入了解Java应用程序的运行状态。以下是主要的JVM诊断工具及其功能:
| 工具名称 | 主要功能 | 使用场景 |
|---|---|---|
| jcmd | 执行JVM命令 | 堆转储、线程转储、性能监控 |
| jmap | 内存映像工具 | 堆内存分析、对象统计 |
| jstack | 线程快照工具 | 死锁检测、线程状态分析 |
| jstat | 统计监控工具 | 垃圾收集统计、类加载统计 |
| async-profiler | 异步性能分析器 | CPU性能分析、内存分配分析 |
jcmd进阶使用技巧
jcmd是JDK 7引入的JVM诊断命令工具,它提供了一种统一的方式来向JVM进程发送诊断命令。相比传统的工具,jcmd具有更丰富的功能和更好的性能表现。
基础命令使用
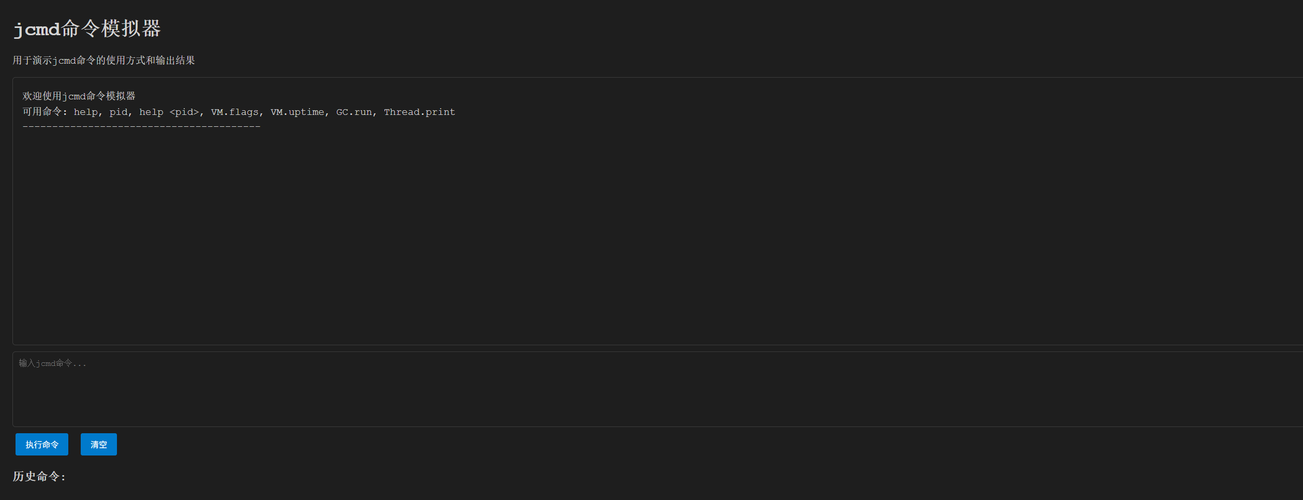
<!DOCTYPE html> <html> <head> <title>jcmd命令模拟器</title> <style> body { font-family: 'Courier New', monospace; background-color: #1e1e1e; color: #d4d4d4; margin: 0; padding: 20px; } .terminal { background-color: #1e1e1e; border: 1px solid #3c3c3c; border-radius: 5px; padding: 15px; margin: 10px 0; height: 400px; overflow-y: auto; } .command { color: #4ec9b0; } .output { color: #d4d4d4; margin: 5px 0; } .prompt { color: #569cd6; } .input-area { width: 100%; height: 100px; background-color: #1e1e1e; color: #d4d4d4; border: 1px solid #3c3c3c; border-radius: 5px; padding: 10px; font-family: 'Courier New', monospace; resize: vertical; } .button { background-color: #007acc; color: white; border: none; padding: 8px 16px; border-radius: 3px; cursor: pointer; margin: 5px; } .button:hover { background-color: #005a9e; } .history { margin-top: 10px; } .history-item { margin: 2px 0; padding: 2px 0; border-bottom: 1px solid #3c3c3c; } </style> </head> <body> <h1>jcmd命令模拟器</h1> <p>用于演示jcmd命令的使用方式和输出结果</p> <div class="terminal" id="terminal"> <div class="output">欢迎使用jcmd命令模拟器</div> <div class="output">可用命令: help, pid, help <pid>, VM.flags, VM.uptime, GC.run, Thread.print</div> <div class="output">----------------------------------------</div> </div> <textarea class="input-area" id="commandInput" placeholder="输入jcmd命令..."></textarea><br> <button class="button" onclick="executeCommand()">执行命令</button> <button class="button" onclick="clearTerminal()">清空</button> <div class="history" id="history"> <h3>历史命令:</h3> </div> <script> let commandHistory = []; function executeCommand() { const input = document.getElementById('commandInput'); const command = input.value.trim(); const terminal = document.getElementById('terminal'); if (!command) return; // 添加到历史记录 commandHistory.push(command); updateHistory(); // 显示命令 terminal.innerHTML += `<div class="output"><span class="prompt">user@host:~$ </span><span class="command">jcmd ` + command + `</span></div>`; // 处理命令 let output = ''; if (command === 'help') { output = `JDK Diagnositc Command (jcmd) Available commands: help - Shows this help message pid - Shows the current process id help <pid> - Shows help for a specific process VM.flags - Shows VM flags VM.uptime - Shows VM uptime VM.system_properties - Shows system properties VM.command_line - Shows the command line used to start this VM VM.class_hierarchy - Shows class hierarchy GC.run - Force garbage collection GC.run_finalization - Force finalization GC.class_histogram - Show a histogram of classes in the Java heap GC.class_stats - Show statistics of classes in the Java heap Thread.print - Print all threads with stack traces Thread.print_concurrent_locks - Print java.util.concurrent locks VM.info - Show per-thread diagnostic information `; } else if (command === 'pid') { output = '12345\n'; } else if (command.startsWith('help ')) { const pid = command.split(' ')[1]; output = `12345: com.example.Application The following commands are available for this process: VM.flags VM.uptime VM.system_properties VM.command_line VM.class_hierarchy GC.run GC.run_finalization GC.class_histogram GC.class_stats Thread.print Thread.print_concurrent_locks VM.info `; } else if (command.includes('GC.class_histogram')) { output = ` num #instances #bytes class name (module) ------------------------------------------------------- 1: 50000 1200000 [C (java.base@11.0.2) 2: 30000 900000 java.lang.String (java.base@11.0.2) 3: 20000 800000 com.example.User (unnamed module @0x1) 4: 15000 600000 java.util.HashMap$Node (java.base@11.0.2) 5: 10000 400000 com.example.Order (unnamed module @0x1) Total 125000 3900000 `; } else if (command.includes('Thread.print')) { output = `2023-12-01 10:30:00 Full thread dump OpenJDK 64-Bit Server VM (11.0.2+9-LTS mixed mode): "main" #1 prio=5 os_prio=0 cpu=1234.56ms elapsed=123.45s tid=0x00007f8b8c022000 nid=0x1234 runnable [0x00007f8b9c7fe000] java.lang.Thread.State: RUNNABLE at java.net.SocketInputStream.socketRead0(java.base@11.0.2/Native Method) at java.net.SocketInputStream.socketRead(java.base@11.0.2/SocketInputStream.java:115) at java.net.SocketInputStream.read(java.base@11.0.2/SocketInputStream.java:168) at java.net.SocketInputStream.read(java.base@11.0.2/SocketInputStream.java:140) "GC task thread#0 (Parallel)" os_prio=0 cpu=12.34ms elapsed=123.45s tid=0x00007f8b8c024800 nid=0x1235 runnable "VM Periodic Task Thread" os_prio=0 cpu=12.34ms elapsed=123.45s tid=0x00007f8b8c025000 nid=0x1236 waiting on condition `; } else if (command.includes('VM.uptime')) { output = '123.45 seconds\n'; } else if (command.includes('VM.flags')) { output = `-XX:+UseParallelGC -XX:InitialHeapSize=268435456 -XX:MaxHeapSize=4294967296 -XX:+PrintGCDetails -XX:+UseG1GC -XX:MaxGCPauseMillis=200 -XX:G1HeapRegionSize=16m `; } else { output = `Command not found or not implemented in this demo: ${ command}\n`; } terminal.innerHTML += `<div class="output">${ output}</div>`; terminal.scrollTop = terminal.scrollHeight; input.value = ''; } function clearTerminal() { document.getElementById('terminal').innerHTML = '<div class="output">欢迎使用jcmd命令模拟器</div><div class="output">可用命令: help, pid, help <pid>, VM.flags, VM.uptime, GC.run, Thread.print</div><div class="output">----------------------------------------</div>'; } function updateHistory() { const historyDiv = document.getElementById('history'); historyDiv.innerHTML = '<h3>历史命令:</h3>'; commandHistory.slice(-10).reverse().forEach(cmd => { const div = document.createElement('div'); div.className = 'history-item'; div.textContent = `jcmd ${ cmd}`; document.getElementById('history').appendChild(div); }); } // 支持回车执行命令 document.getElementById('commandInput').addEventListener('keypress', function(e) { if (e.key === 'Enter' && !e.shiftKey) { e.preventDefault(); executeCommand(); } }); </script> </body> </html> 高级诊断命令
jcmd的高级功能包括性能分析、内存转储、线程分析等。以下是一些常用的高级命令示例: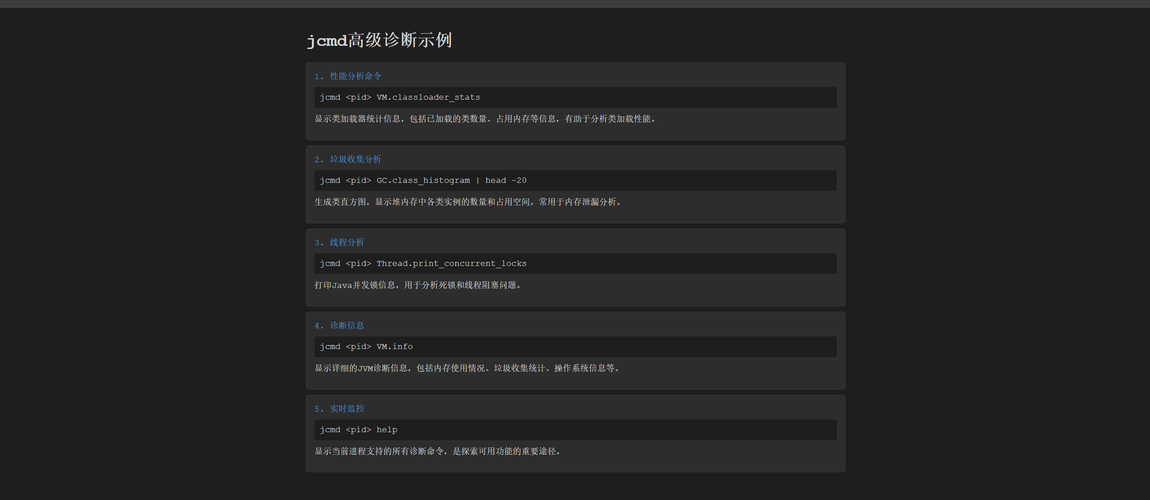
<!DOCTYPE html> <html> <head> <title>jcmd高级诊断示例</title> <style> body { font-family: 'Courier New', monospace; background-color: #1e1e1e; color: #d4d4d4; margin: 0; padding: 20px; } .container { max-width: 1000px; margin: 0 auto; } .command-section { background-color: #2d2d2d; border: 1px solid #3c3c3c; border-radius: 5px; padding: 15px; margin: 10px 0; } .command-title { color: #569cd6; margin-bottom: 10px; } .command-example { background-color: #1e1e1e; padding: 10px; border-radius: 3px; margin: 5px 0; font-family: 'Courier New', monospace; } .explanation { margin: 10px 0; line-height: 1.5; } .highlight { color: #4ec9b0; font-weight: bold; } </style> </head> <body> <div class="container"> <h1>jcmd高级诊断示例</h1> <div class="command-section"> <div class="command-title">1. 性能分析命令</div> <div class="command-example">jcmd <pid> VM.classloader_stats</div> <div class="explanation">显示类加载器统计信息,包括已加载的类数量、占用内存等信息,有助于分析类加载性能。</div> </div> <div class="command-section"> <div class="command-title">2. 垃圾收集分析</div> <div class="command-example">jcmd <pid> GC.class_histogram | head -20</div> <div class="explanation">生成类直方图,显示堆内存中各类实例的数量和占用空间,常用于内存泄漏分析。</div> </div> <div class="command-section"> <div class="command-title">3. 线程分析</div> <div class="command-example">jcmd <pid> Thread.print_concurrent_locks</div> <div class="explanation">打印Java并发锁信息,用于分析死锁和线程阻塞问题。</div> </div> <div class="command-section"> <div class="command-title">4. 诊断信息</div> <div class="command-example">jcmd <pid> VM.info</div> <div class="explanation">显示详细的JVM诊断信息,包括内存使用情况、垃圾收集统计、操作系统信息等。</div> </div> <div class="command-section"> <div class="command-title">5. 实时监控</div> <div class="command-example">jcmd <pid> help</div> <div class="explanation">显示当前进程支持的所有诊断命令,是探索可用功能的重要途径。</div> </div> </div> </body> </html> jmap深度解析
jmap是Java内存映像工具,主要用于生成堆转储文件和查看堆内存使用情况。在内存泄漏分析和性能调优中,jmap是一个不可或缺的工具。
jmap基本使用
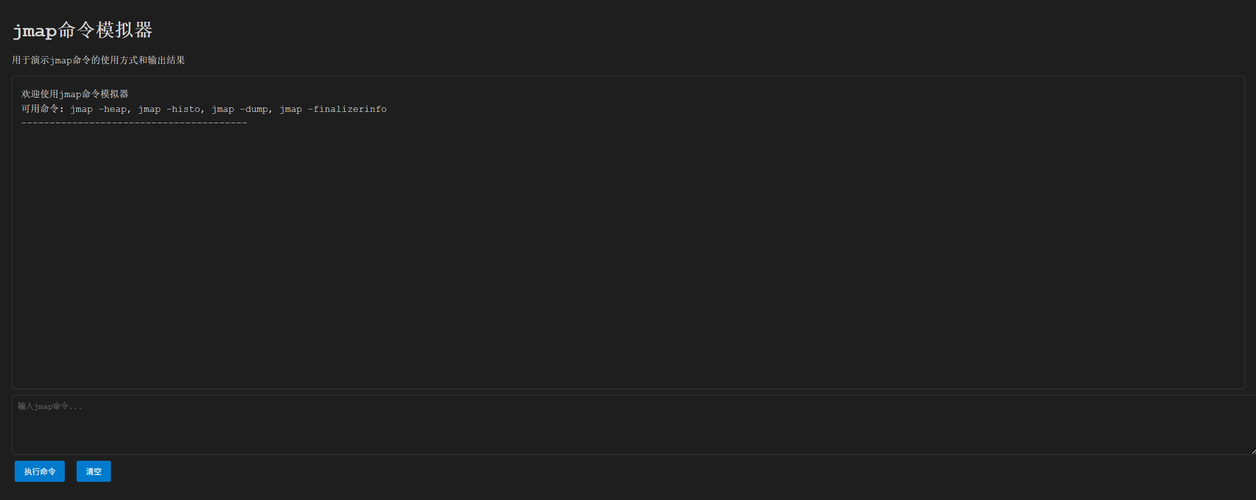
<!DOCTYPE html> <html> <head> <title>jmap命令模拟器</title> <style> body { font-family: 'Courier New', monospace; background-color: #1e1e1e; color: #d4d4d4; margin: 0; padding: 20px; } .terminal { background-color: #1e1e1e; border: 1px solid #3c3c3c; border-radius: 5px; padding: 15px; margin: 10px 0; height: 500px; overflow-y: auto; } .command { color: #4ec9b0; } .output { color: #d4d4d4; margin: 5px 0; } .prompt { color: #569cd6; } .input-area { width: 100%; height: 80px; background-color: #1e1e1e; color: #d4d4d4; border: 1px solid #3c3c3c; border-radius: 5px; padding: 10px; font-family: 'Courier New', monospace; resize: vertical; } .button { background-color: #007acc; color: white; border: none; padding: 8px 16px; border-radius: 3px; cursor: pointer; margin: 5px; } .button:hover { background-color: #005a9e; } .memory-info { background-color: #2d2d2d; padding: 10px; border-radius: 5px; margin: 10px 0; } .heap-section { margin: 15px 0; padding: 10px; border-left: 3px solid #569cd6; } </style> </head> <body> <h1>jmap命令模拟器</h1> <p>用于演示jmap命令的使用方式和输出结果</p> <div class="terminal" id="terminal"> <div class="output">欢迎使用jmap命令模拟器</div> <div class="output">可用命令: jmap -heap, jmap -histo, jmap -dump, jmap -finalizerinfo</div> <div class="output">----------------------------------------</div> </div> <textarea class="input-area" id="commandInput" placeholder="输入jmap命令..."></textarea><br> <button class="button" onclick="executeCommand()">执行命令</button> <button class="button" onclick="clearTerminal()">清空</button> <script> function executeCommand() { const input = document.getElementById('commandInput'); const command = input.value.trim(); const terminal = document.getElementById('terminal'); if (!command) return; // 显示命令 terminal.innerHTML += `<div class="output"><span class="prompt">user@host:~$ </span><span class="command">jmap ` + command + `</span></div>`; // 处理命令 let output = ''; if (command.includes('-heap')) { output = `Attaching to process ID 12345, please wait... Debugger attached successfully. Server compiler detected. JVM version is 11.0.2+9-LTS using thread-local object allocation. Parallel GC with 4 thread(s) Heap Configuration: MinHeapFreeRatio = 0 MaxHeapFreeRatio = 100 MaxHeapSize = 4294967296 (4096.0MB) NewSize = 89128960 (85.0MB) MaxNewSize = 1431306240 (1365.0MB) OldSize = 179306496 (171.0MB) NewRatio = 2 SurvivorRatio = 8 MetaspaceSize = 21807104 (20.796875MB) CompressedClassSpaceSize = 1073741824 (1024.0MB) MaxMetaspaceSize = 17592186044415 MB G1HeapRegionSize = 16384 (16.0MB) Heap Usage: PS Young Generation Eden Space: capacity = 62914560 (60.0MB) used = 31457280 (30.0MB) free = 31457280 (30.0MB) 50.0% used From Space: capacity = 10485760 (10.0MB) used = 0 (0.0MB) free = 10485760 (10.0MB) 0.0% used To Space: capacity = 10485760 (10.0MB) used = 0 (0.0MB) free = 10485760 (10.0MB) 0.0% used PS Old Generation capacity = 1744830464 (1664.0MB) used = 872415232 (832.0MB) free = 872415232 (832.0MB) 50.0% used 507 interned Strings occupying 45678 bytes. `; } else if (command.includes('-histo')) { output = ` num #instances #bytes class name (module) ------------------------------------------------------- 1: 50000 1200000 [C (java.base@11.0.2) 2: 30000 900000 java.lang.String (java.base@11.0.2) 3: 20000 800000 com.example.User (unnamed module @0x1) 4: 15000 600000 java.util.HashMap$Node (java.base@11.0.2) 5: 10000 400000 com.example.Order (unnamed module @0x1) 6: 8000 320000 java.util.ArrayList (java.base@11.0.2) 7: 6000 240000 com.example.Product (unnamed module @0x1) 8: 5000 200000 java.util.HashMap (java.base@11.0.2) 9: 4000 160000 java.lang.Class (java.base@11.0.2) 10: 3000 120000 java.lang.Object (java.base@11.0.2) 11: 2000 80000 com.example.Session (unnamed module @0x1) 12: 1500 60000 java.util.concurrent.ConcurrentHashMap$Node (java.base@11.0.2) 13: 1000 40000 java.util.TreeMap$Entry (java.base@11.0.2) 14: 800 32000 java.lang.ref.SoftReference (java.base@11.0.2) 15: 600 24000 java.lang.ref.WeakReference (java.base@11.0.2) Total 142300 4946000 Class Histogram (all classes) Total count: 142300, Total size: 4946000 bytes `; } else if (command.includes('-dump')) { output = `Dumping heap to /tmp/heap_dump_20231201.hprof ... Heap dump file created [4946000 bytes] in 2.345 secs Dump location: /tmp/heap_dump_20231201.hprof Compression: uncompressed Format: binary `; } else if (command.includes('-finalizerinfo')) { output = `Attaching to process ID 12345, please wait... Debugger attached successfully. Server compiler detected. JVM version is 11.0.2+9-LTS Number of objects pending for finalization: 0 `; } else { output = `Invalid jmap command: ${ command}\nUsage: jmap [option] <pid>\n jmap [option] <executable <core>\n jmap [option] [server_id@]<remote server IP or hostname>\n\nOptions:\n -dump:[live,]format=b,file=<filename> to dump java heap in binary hprof- format\n -finalizerinfo to print information about objects awaiting finalization\n -heap to print java heap summary\n -histo[:live] to print histogram of java heap\n -permstat to print permanent generation statistics\n -F force. Use with -dump or -histo\n to force a heap dump or histogram\n when <pid> does not respond\n -h | -help to print this help message\n -J<flag> to pass <flag> directly to the runtime system\n`; } terminal.innerHTML += `<div class="output">${ output}</div>`; terminal.scrollTop = terminal.scrollHeight; input.value = ''; } function clearTerminal() { document.getElementById('terminal').innerHTML = '<div class="output">欢迎使用jmap命令模拟器</div><div class="output">可用命令: jmap -heap, jmap -histo, jmap -dump, jmap -finalizerinfo</div><div class="output">----------------------------------------</div>'; } // 支持回车执行命令 document.getElementById('commandInput').addEventListener('keypress', function(e) { if (e.key === 'Enter' && !e.shiftKey) { e.preventDefault(); executeCommand(); } }); </script> </body> </html> jmap高级应用
jmap的高级应用包括堆转储分析、内存泄漏检测等。以下是几个实际应用示例: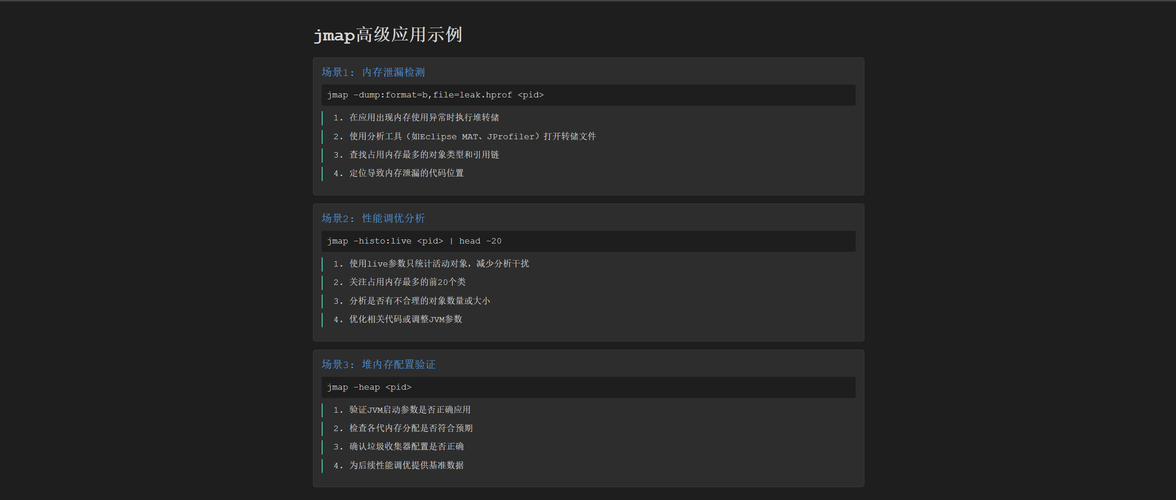
<!DOCTYPE html> <html> <head> <title>jmap高级应用示例</title> <style> body { font-family: 'Courier New', monospace; background-color: #1e1e1e; color: #d4d4d4; margin: 0; padding: 20px; } .container { max-width: 1000px; margin: 0 auto; } .scenario { background-color: #2d2d2d; border: 1px solid #3c3c3c; border-radius: 5px; padding: 15px; margin: 15px 0; } .scenario-title { color: #569cd6; margin-bottom: 10px; font-size: 1.2em; } .command-block { background-color: #1e1e1e; padding: 10px; border-radius: 3px; margin: 10px 0; } .analysis { margin: 10px 0; line-height: 1.6; } .step { margin: 8px 0; padding-left: 20px; border-left: 2px solid #4ec9b0; } </style> </head> <body> <div class="container"> <h1>jmap高级应用示例</h1> <div class="scenario"> <div class="scenario-title">场景1: 内存泄漏检测</div> <div class="command-block">jmap -dump:format=b,file=leak.hprof <pid></div> <div class="analysis"> <div class="step">1. 在应用出现内存使用异常时执行堆转储</div> <div class="step">2. 使用分析工具(如Eclipse MAT、JProfiler)打开转储文件</div> <div class="step">3. 查找占用内存最多的对象类型和引用链</div> <div class="step">4. 定位导致内存泄漏的代码位置</div> </div> </div> <div class="scenario"> <div class="scenario-title">场景2: 性能调优分析</div> <div class="command-block">jmap -histo:live <pid> | head -20</div> <div class="analysis"> <div class="step">1. 使用live参数只统计活动对象,减少分析干扰</div> <div class="step">2. 关注占用内存最多的前20个类</div> <div class="step">3. 分析是否有不合理的对象数量或大小</div> <div class="step">4. 优化相关代码或调整JVM参数</div> </div> </div> <div class="scenario"> <div class="scenario-title">场景3: 堆内存配置验证</div> <div class="command-block">jmap -heap <pid></div> <div class="analysis"> <div class="step">1. 验证JVM启动参数是否正确应用</div> <div class="step">2. 检查各代内存分配是否符合预期</div> <div class="step">3. 确认垃圾收集器配置是否正确</div> <div class="step">4. 为后续性能调优提供基准数据</div> </div> </div> </div> </body> </html> async-profiler实战指南
async-profiler是阿里巴巴开源的高性能Java性能分析工具,相比传统的JProfiler、VisualVM等工具,它具有低开销、高精度的特点,特别适合生产环境使用。
async-profiler安装与配置
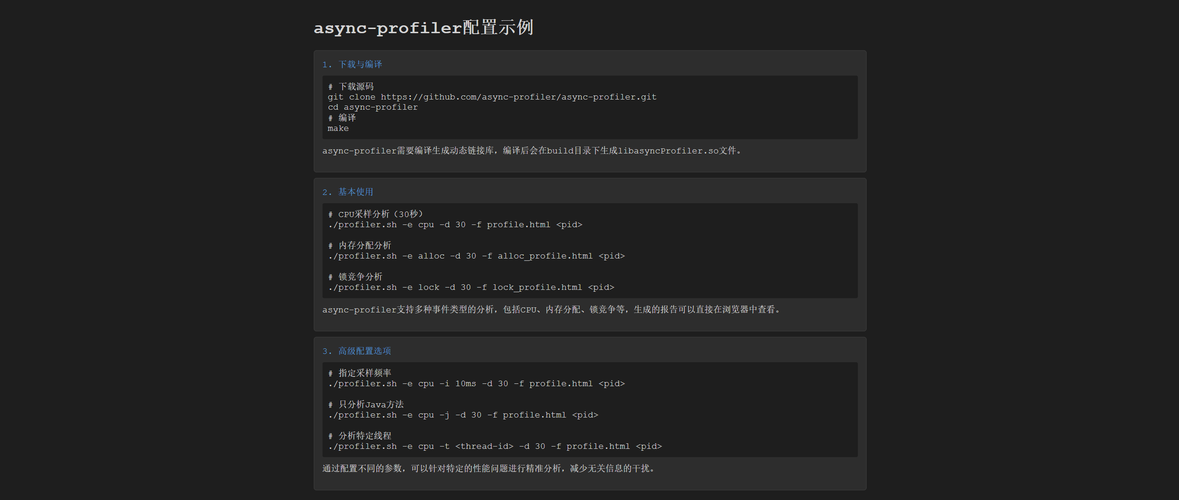
<!DOCTYPE html> <html> <head> <title>async-profiler配置示例</title> <style> body { font-family: 'Courier New', monospace; background-color: #1e1e1e; color: #d4d4d4; margin: 0; padding: 20px; } .container { max-width: 1000px; margin: 0 auto; } .setup-section { background-color: #2d2d2d; border: 1px solid #3c3c3c; border-radius: 5px; padding: 15px; margin: 10px 0; } .setup-title { color: #569cd6; margin-bottom: 10px; } .code-block { background-color: #1e1e1e; padding: 10px; border-radius: 3px; margin: 10px 0; overflow-x: auto; } .explanation { margin: 10px 0; line-height: 1.5; } .highlight { color: #4ec9b0; font-weight: bold; } </style> </head> <body> <div class="container"> <h1>async-profiler配置示例</h1> <div class="setup-section"> <div class="setup-title">1. 下载与编译</div> <div class="code-block"> # 下载源码<br> git clone https://github.com/async-profiler/async-profiler.git<br> cd async-profiler<br> # 编译<br> make </div> <div class="explanation">async-profiler需要编译生成动态链接库,编译后会在build目录下生成libasyncProfiler.so文件。</div> </div> <div class="setup-section"> <div class="setup-title">2. 基本使用</div> <div class="code-block"> # CPU采样分析(30秒)<br> ./profiler.sh -e cpu -d 30 -f profile.html <pid><br><br> # 内存分配分析<br> ./profiler.sh -e alloc -d 30 -f alloc_profile.html <pid><br><br> # 锁竞争分析<br> ./profiler.sh -e lock -d 30 -f lock_profile.html <pid> </div> <div class="explanation">async-profiler支持多种事件类型的分析,包括CPU、内存分配、锁竞争等,生成的报告可以直接在浏览器中查看。</div> </div> <div class="setup-section"> <div class="setup-title">3. 高级配置选项</div> <div class="code-block"> # 指定采样频率<br> ./profiler.sh -e cpu -i 10ms -d 30 -f profile.html <pid><br><br> # 只分析Java方法<br> ./profiler.sh -e cpu -j -d 30 -f profile.html <pid><br><br> # 分析特定线程<br> ./profiler.sh -e cpu -t <thread-id> -d 30 -f profile.html <pid> </div> <div class="explanation">通过配置不同的参数,可以针对特定的性能问题进行精准分析,减少无关信息的干扰。</div> </div> </div> </body> </html> async-profiler实战案例
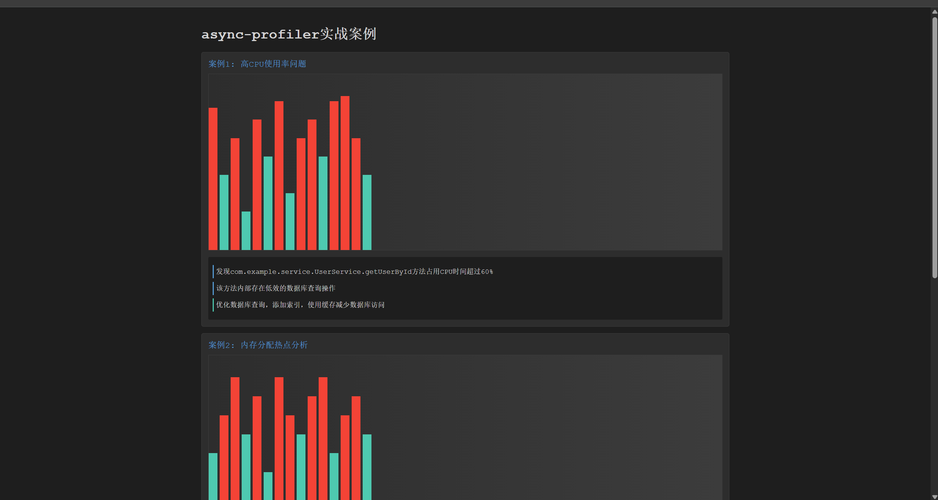
<!DOCTYPE html> <html> <head> <title>async-profiler实战案例</title> <style> body { font-family: 'Courier New', monospace; background-color: #1e1e1e; color: #d4d4d4; margin: 0; padding: 20px; } .container { max-width: 1200px; margin: 0 auto; } .case-study { background-color: #2d2d2d; border: 1px solid #3c3c3c; border-radius: 5px; padding: 15px; margin: 15px 0; } .case-title { color: #569cd6; margin-bottom: 10px; font-size: 1.2em; } .profile-container { height: 400px; border: 1px solid #3c3c3c; margin: 10px 0; position: relative; background: linear-gradient(90deg, #2d2d2d 0%, #3c3c3c 100%); overflow: hidden; } .profile-bar { position: absolute; bottom: 0; width: 20px; background: #4ec9b0; transition: height 0.3s; } .profile-label { position: absolute; bottom: -20px; width: 20px; text-align: center; font-size: 10px; transform: rotate(-45deg); transform-origin: top center; } .analysis-result { margin-top: 15px; padding: 10px; background-color: #1e1e1e; border-radius: 3px; } .finding { margin: 8px 0; padding: 5px; border-left: 3px solid #569cd6; } .recommendation { margin: 8px 0; padding: 5px; border-left: 3px solid #4ec9b0; } </style> </head> <body> <div class="container"> <h1>async-profiler实战案例</h1> <div class="case-study"> <div class="case-title">案例1: 高CPU使用率问题</div> <div class="profile-container" id="cpuProfile1"> <!-- 动态生成的性能分析图 --> </div> <div class="analysis-result"> <div class="finding">发现com.example.service.UserService.getUserById方法占用CPU时间超过60%</div> <div class="finding">该方法内部存在低效的数据库查询操作</div> <div class="recommendation">优化数据库查询,添加索引,使用缓存减少数据库访问</div> </div> </div> <div class="case-study"> <div class="case-title">案例2: 内存分配热点分析</div> <div class="profile-container" id="memoryProfile1"> <!-- 动态生成的内存分析图 --> </div> <div class="analysis-result"> <div class="finding">com.example.model.Order类的实例化操作频繁</div> <div class="finding">每次创建订单时都会创建大量临时对象</div> <div class="recommendation">使用对象池模式,减少对象创建频率</div> </div> </div> <div class="case-study"> <div class="case-title">案例3: 锁竞争问题</div> <div class="profile-container" id="lockProfile1"> <!-- 动态生成的锁分析图 --> </div> <div class="analysis-result"> <div class="finding">com.example.cache.CacheManager.get方法存在严重锁竞争</div> <div class="finding">高并发下多个线程等待同一把锁</div> <div class="recommendation">使用ConcurrentHashMap替换同步Map,减少锁粒度</div> </div> </div> </div> <script> // 生成模拟的性能分析图 function generateProfileChart(containerId, data) { const container = document.getElementById(containerId); container.innerHTML = ''; const maxValue = Math.max(...data); const barWidth = 25; const totalWidth = data.length * barWidth; data.forEach((value, index) => { const height = (value / maxValue) * 350; const bar = document.createElement('div'); bar.className = 'profile-bar'; bar.style.height = height + 'px'; bar.style.left = (index * barWidth) + 'px'; bar.style.backgroundColor = value > maxValue * 0.7 ? '#f44336' : '#4ec9b0'; const label = document.createElement('div'); label.className = 'profile-label'; label.textContent = `M${ index + 1}`; label.style.left = (index * barWidth) + 'px'; container.appendChild(bar); container.appendChild(label); }); } // 页面加载时生成图表 window.onload = function() { // CPU分析数据 const cpuData = [85, 45, 67, 23, 78, 56, 89, 34, 67, 78, 56, 89, 92, 67, 45]; generateProfileChart('cpuProfile1', cpuData); // 内存分析数据 const memoryData = [45, 67, 89, 56, 78, 34, 89, 67, 56, 78, 89, 45, 67, 78, 56]; generateProfileChart('memoryProfile1', memoryData); // 锁分析数据 const lockData = [12, 34, 56, 78, 89, 67, 45, 78, 89, 56, 34, 67, 78, 89, 56]; generateProfileChart('lockProfile1', lockData); }; </script> </body> </html> 综合诊断策略
在实际的JVM性能诊断中,单一工具往往难以解决复杂问题。需要结合多种工具,形成综合的诊断策略。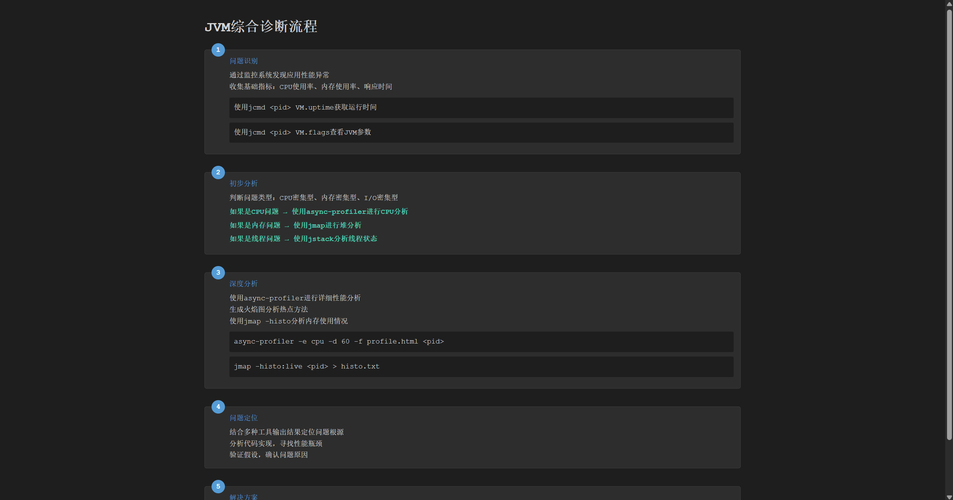
<!DOCTYPE html> <html> <head> <title>JVM综合诊断流程</title> <style> body { font-family: 'Courier New', monospace; background-color: #1e1e1e; color: #d4d4d4; margin: 0; padding: 20px; } .container { max-width: 1200px; margin: 0 auto; } .diagnosis-flow { display: flex; flex-direction: column; gap: 20px; } .flow-step { background-color: #2d2d2d; border: 1px solid #3c3c3c; border-radius: 5px; padding: 15px; margin: 10px 0; position: relative; } .step-number { position: absolute; top: -15px; left: 15px; background-color: #569cd6; color: white; width: 30px; height: 30px; border-radius: 50%; display: flex; align-items: center; justify-content: center; font-weight: bold; } .step-title { color: #569cd6; margin-left: 40px; margin-bottom: 10px; } .step-content { margin-left: 40px; line-height: 1.6; } .tool-usage { background-color: #1e1e1e; padding: 10px; border-radius: 3px; margin: 10px 0; } .decision-point { color: #4ec9b0; font-weight: bold; margin: 5px 0; } </style> </head> <body> <div class="container"> <h1>JVM综合诊断流程</h1> <div class="diagnosis-flow"> <div class="flow-step"> <div class="step-number">1</div> <div class="step-title">问题识别</div> <div class="step-content"> <div>通过监控系统发现应用性能异常</div> <div>收集基础指标:CPU使用率、内存使用率、响应时间</div> <div class="tool-usage">使用jcmd <pid> VM.uptime获取运行时间</div> <div class="tool-usage">使用jcmd <pid> VM.flags查看JVM参数</div> </div> </div> <div class="flow-step"> <div class="step-number">2</div> <div class="step-title">初步分析</div> <div class="step-content"> <div>判断问题类型:CPU密集型、内存密集型、I/O密集型</div> <div class="decision-point">如果是CPU问题 → 使用async-profiler进行CPU分析</div> <div class="decision-point">如果是内存问题 → 使用jmap进行堆分析</div> <div class="decision-point">如果是线程问题 → 使用jstack分析线程状态</div> </div> </div> <div class="flow-step"> <div class="step-number">3</div> <div class="step-title">深度分析</div> <div class="step-content"> <div>使用async-profiler进行详细性能分析</div> <div>生成火焰图分析热点方法</div> <div>使用jmap -histo分析内存使用情况</div> <div class="tool-usage">async-profiler -e cpu -d 60 -f profile.html <pid></div> <div class="tool-usage">jmap -histo:live <pid> > histo.txt</div> </div> </div> <div class="flow-step"> <div class="step-number">4</div> <div class="step-title">问题定位</div> <div class="step-content"> <div>结合多种工具输出结果定位问题根源</div> <div>分析代码实现,寻找性能瓶颈</div> <div>验证假设,确认问题原因</div> </div> </div> <div class="flow-step"> <div class="step-number">5</div> <div class="step-title">解决方案</div> <div class="step-content"> <div>制定优化方案</div> <div>实施代码优化或JVM参数调整</div> <div>验证优化效果</div> </div> </div> </div> </div> </body> </html> 通过合理运用jcmd、jmap、async-profiler等JVM诊断工具,并结合系统化的诊断流程,我们可以高效地解决各种JVM性能问题,保障Java应用的稳定运行。
关于作者
🌟 我是suxiaoxiang,一位热爱技术的开发者
💡 专注于Java生态和前沿技术分享
🚀 持续输出高质量技术内容
如果这篇文章对你有帮助,请支持一下:
👍 点赞
⭐ 收藏
👀 关注
您的支持是我持续创作的动力!感谢每一位读者的关注与认可!