Annotated locations of soil samples along the Dutch bank of the Meuse River north of Maastricht
Examples
Basic Examples (2)
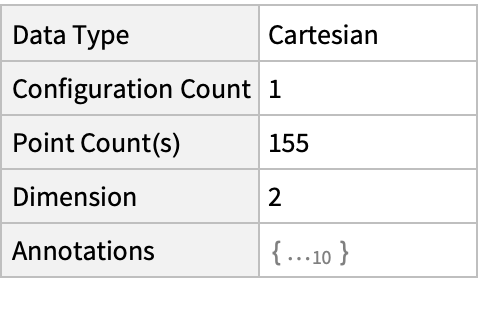
Summary of the spatial point data:
List annotations keys:
Visualizations (5)
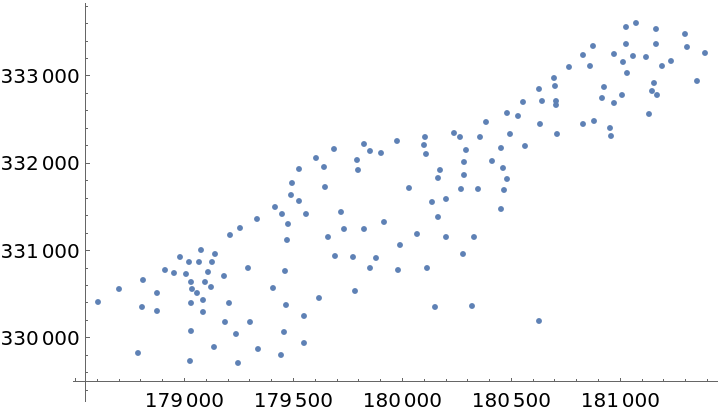
Plot the locations:
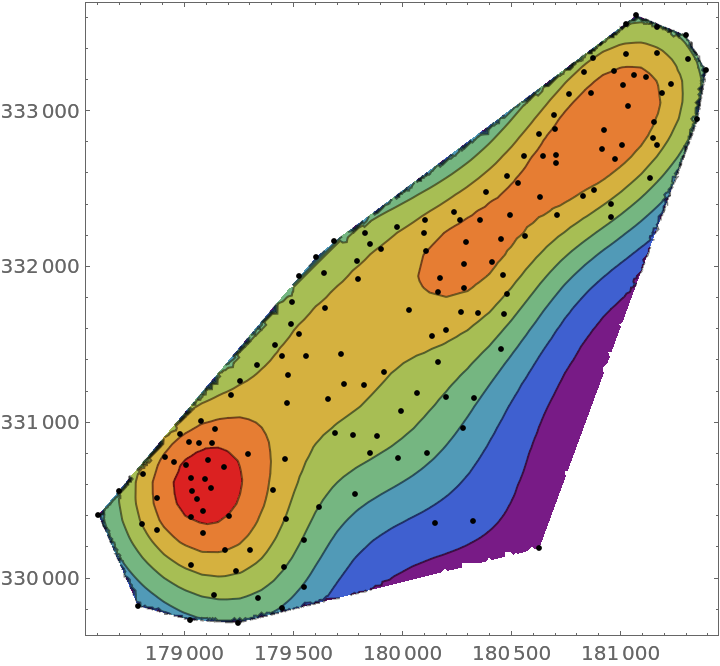
Visualize the smooth point density:
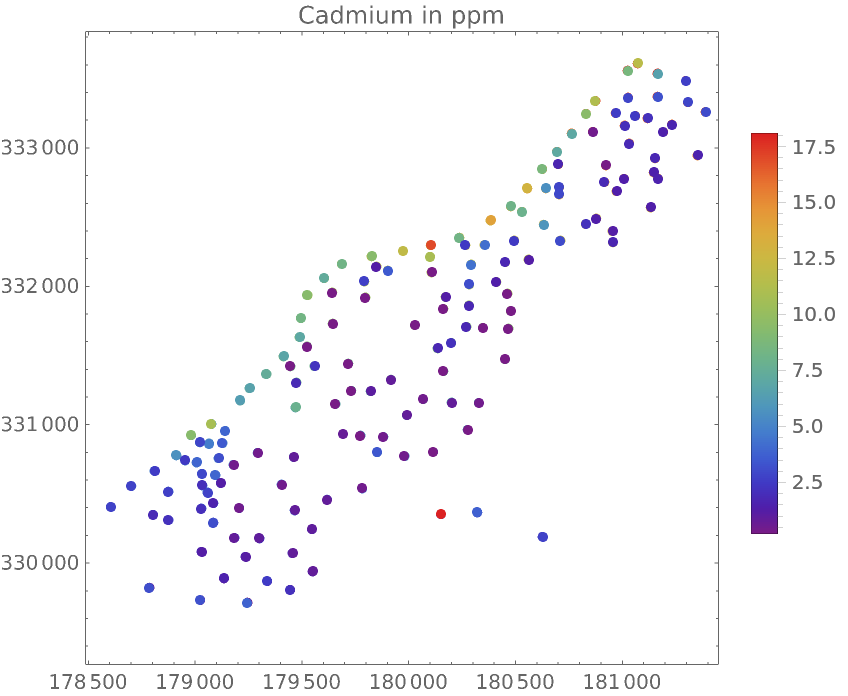
Visualize points with some annotations:
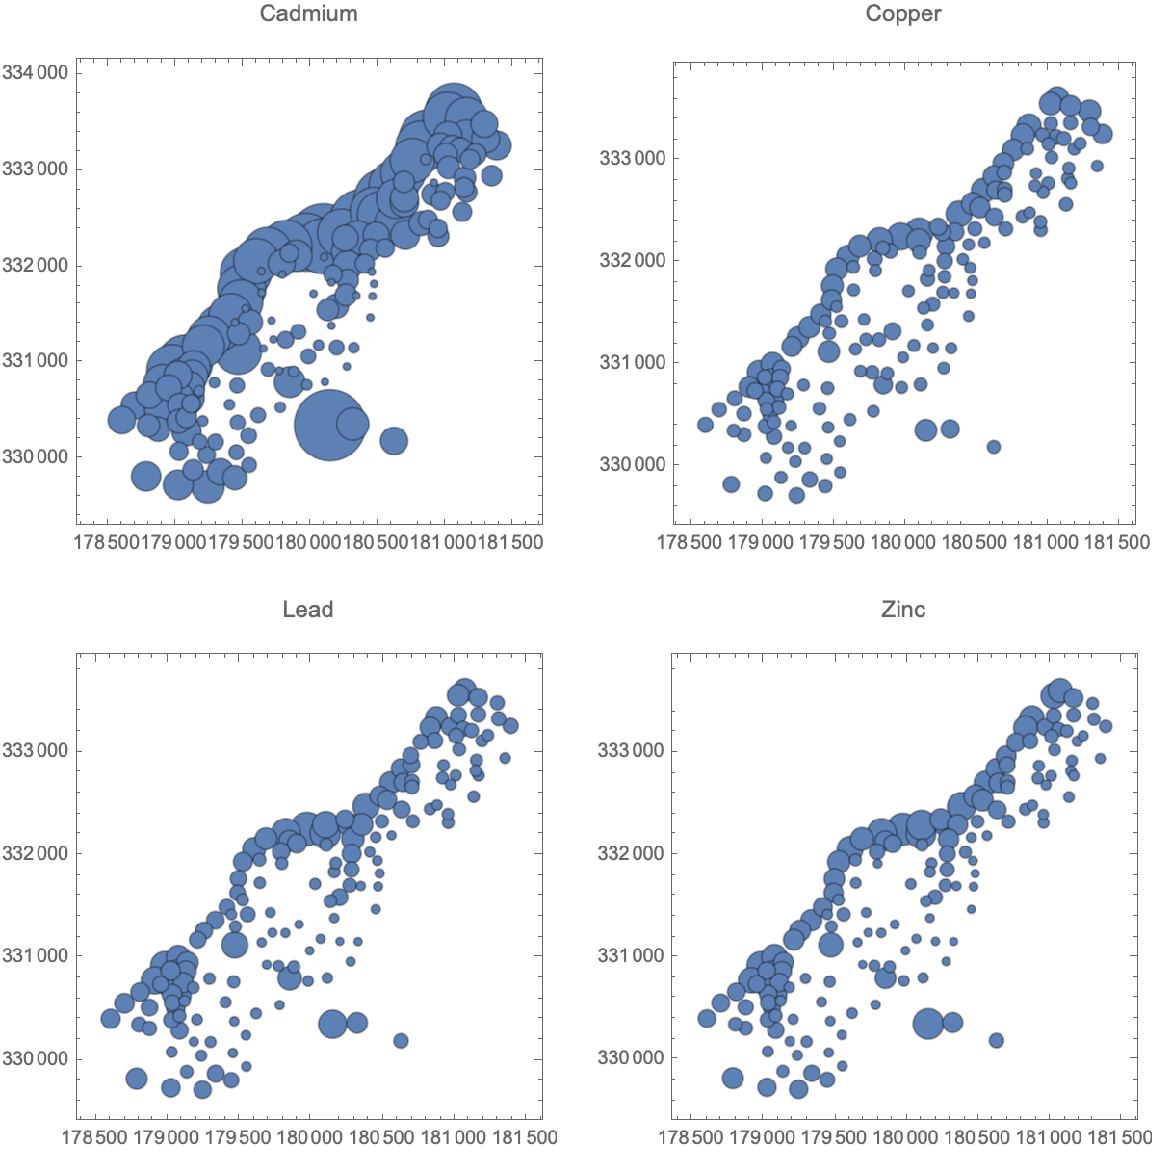
Compare distributions of the four metals:
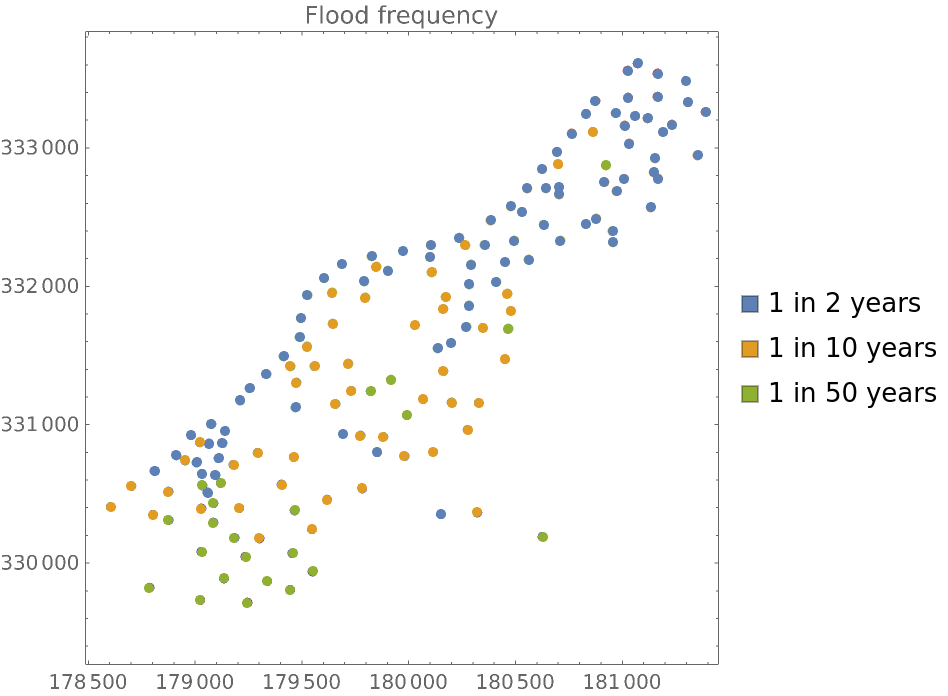
Flood frequency at locations:
Analysis (3)
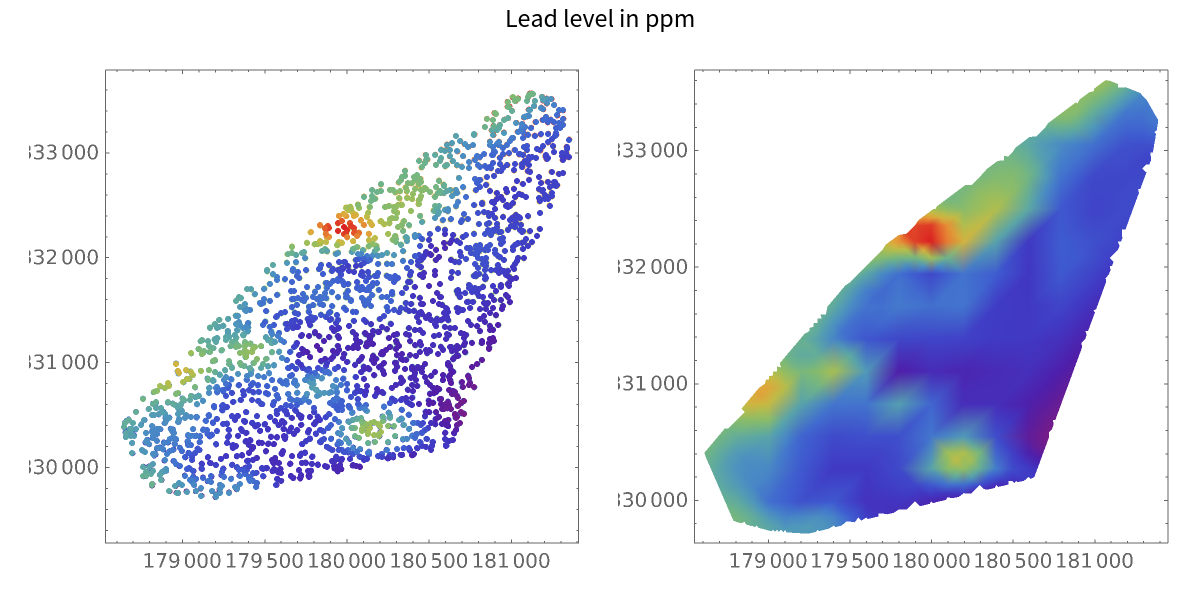
Use SpatialEstimate to create a continuous estimate from sparse observation locations:
Create a set of random points and compute the estimated values at these locations:Visualize the values over the whole region:
Bibliographic Citation
Gosia Konwerska, "Sample Data: Meuse River" from the Wolfram Data Repository (2022)
Data Resource History
Publisher Information


![Show[ContourPlot[density[{x, y}], {x, y} \[Element] ResourceData[\!\(\* TagBox["\"\<Sample Data: Meuse River\>\"", #& , BoxID -> "ResourceTag-Sample Data: Meuse River-Input", AutoDelete->True]\), "ObservationRegion"], ColorFunction -> "Rainbow"], ListPlot[ResourceData[\!\(\* TagBox["\"\<Sample Data: Meuse River\>\"", #& , BoxID -> "ResourceTag-Sample Data: Meuse River-Input", AutoDelete->True]\), "Data"], PlotStyle -> Black]]](https://www.wolframcloud.com/obj/resourcesystem/images/a23/a23736ac-187b-4340-8501-473248db5bee/242b30e02f2817a3.png)
![PointValuePlot[ResourceData[\!\(\* TagBox["\"\<Sample Data: Meuse River\>\"", #& , BoxID -> "ResourceTag-Sample Data: Meuse River-Input", AutoDelete->True]\), "Locations"] -> ResourceData[\!\(\* TagBox["\"\<Sample Data: Meuse River\>\"", #& , BoxID -> "ResourceTag-Sample Data: Meuse River-Input", AutoDelete->True]\), "Annotations"]["Cadmium"], ColorFunction -> "Rainbow", PlotLegends -> Automatic, PlotLabel -> "Cadmium in ppm"]](https://www.wolframcloud.com/obj/resourcesystem/images/a23/a23736ac-187b-4340-8501-473248db5bee/12d623953e70c5a9.png)
![With[{pts = ResourceData[\!\(\* TagBox["\"\<Sample Data: Meuse River\>\"", #& , BoxID -> "ResourceTag-Sample Data: Meuse River-Input", AutoDelete->True]\), "Locations"]}, GraphicsGrid@ Partition[Table[PointValuePlot[pts -> (ResourceData[\!\(\* TagBox["\"\<Sample Data: Meuse River\>\"", #& , BoxID -> "ResourceTag-Sample Data: Meuse River-Input", AutoDelete->True]\), "Annotations"][elements[[k]]]), {1 -> "Size"}, PlotLabel -> elements[[k]]], {k, 1, 4}], 2]]](https://www.wolframcloud.com/obj/resourcesystem/images/a23/a23736ac-187b-4340-8501-473248db5bee/56b1ae1f465fc8c2.png)
![PointValuePlot[ResourceData[\!\(\* TagBox["\"\<Sample Data: Meuse River\>\"", #& , BoxID -> "ResourceTag-Sample Data: Meuse River-Input", AutoDelete->True]\), "Locations"] -> ResourceData[\!\(\* TagBox["\"\<Sample Data: Meuse River\>\"", #& , BoxID -> "ResourceTag-Sample Data: Meuse River-Input", AutoDelete->True]\), "Annotations"]["FloodFrequency"], ColorFunction -> "Rainbow", PlotLegends -> Automatic, PlotLabel -> "Flood frequency"]](https://www.wolframcloud.com/obj/resourcesystem/images/a23/a23736ac-187b-4340-8501-473248db5bee/54ff9e5a3ffe8db9.png)

![Labeled[GraphicsRow[{PointValuePlot[pts -> vals, ColorFunction -> "Rainbow"], DensityPlot[est[{x, y}], {x, y} \[Element] ResourceData[\!\(\* TagBox["\"\<Sample Data: Meuse River\>\"", #& , BoxID -> "ResourceTag-Sample Data: Meuse River-Input", AutoDelete->True]\), "ObservationRegion"], ColorFunction -> "Rainbow"]}], "Lead level in ppm", Top]](https://www.wolframcloud.com/obj/resourcesystem/images/a23/a23736ac-187b-4340-8501-473248db5bee/059f6405bcd636d6.png)