The TSPg software implements the following algorithm that approximates Ward's agglomerative clustering:
Sieranoja, S., Fränti, P. Fast agglomerative clustering using approximate traveling salesman solutions. Journal of Big Data 12, 21 (2025). https://doi.org/10.1186/s40537-024-01053-x
The software is provided with GNU Lesser General Public License, Version 3. https://www.gnu.org/licenses/lgpl.html. All files except those under data and contrib -folders are subject to this license. See LICENSE.txt.
Contact: samisi@cs.uef.fi
Please, let me know how the software works for you if you try it out.
git clone https://github.com/uef-machine-learning/tspgclu.git cd tspgclu pip install -r requirements.txt pip install . python python/ex_cluster.py See ex_* files in directory python/
(see file python/ex_cluster.py)
import numpy as np import matplotlib.pyplot as plt import tspg def show_clusters_2d(x,labels,numclu): colormap = plt.cm.gist_ncar colorst = [colormap(i) for i in np.linspace(0, 0.9,numclu)] # print(colorst) u_labels = np.unique(labels) for i in u_labels: plt.scatter(x[labels == i , 0] , x[labels == i , 1] , label = i, color = colorst[i-1]) plt.show() # Fast version using built in distance functions written in C++: def example_vec(ds,numclu): # For higher quality: # - increase number of tsp paths (num_tsp), (in range [2,100]) # Needs ds input in python list format labels,mergeOrder = tspg.tspg(ds.tolist(),numclu,distance="l2",num_tsp=5,dtype="vec") show_clusters_2d(ds,labels,numclu) x=np.loadtxt('data/s1.txt') example_vec(x,15)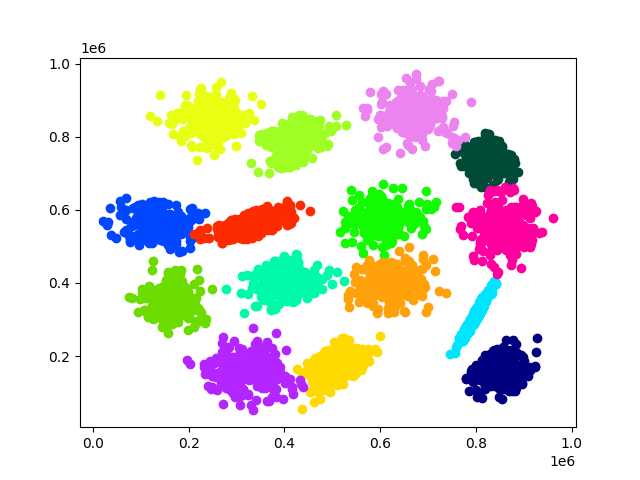
... ds = np.genfromtxt('data/s1_small.txt') labels,mergeOrder = tspg.tspg(ds.tolist(),1,distance="l2",num_tsp=5,dtype="vec") mergeOrder_scipy = mergeOrderToScipyFormat(mergeOrder) fig, axs = plt.subplots(1, 2, figsize=(12, 6), gridspec_kw={'width_ratios': [1, 1]}) plt1 = axs[0]; plt2 = axs[1] # Create 2d plot showing the merges plt1.scatter(ds[:, 0], ds[:, 1], marker='o', color='b') for pair in mergeOrder: plt1.plot([ds[pair[0],0], ds[pair[1],0]] , [ds[pair[0],1], ds[pair[1],1]], 'k-') plt1.set_title('Merge Order') # Plot the dendrogram dendrogram(mergeOrder_scipy,ax=plt2,no_labels=True) plt2.set_title('Hierarchical Clustering Dendrogram') plt.show()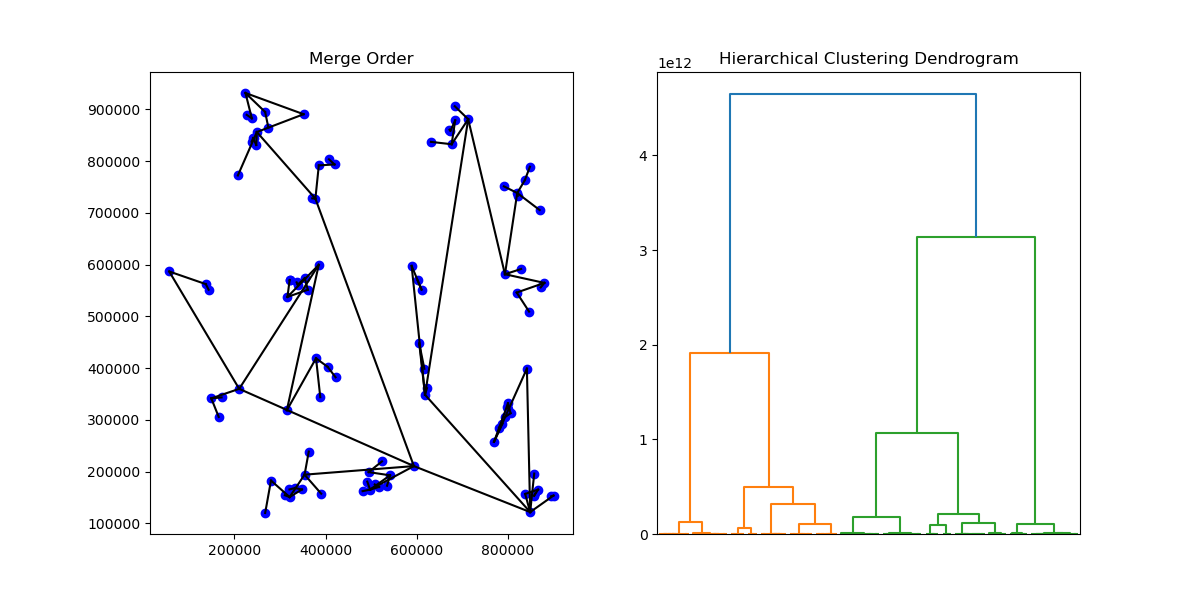
(file python/ex_create_graph.py)
import numpy as np import matplotlib.pyplot as plt import tspg x=np.loadtxt('data/s1_small.txt') # the graph is represented as num_tsp different linear orderings between the data x paths = tspg.create_graph(x.tolist(),distance="l2",num_tsp=4) plt.figure(figsize=(6, 6)) plt.scatter(x[:, 0], x[:, 1], marker='o', color='b') for tsp in paths: for i in range(0,len(tsp)-1): # Draw line betwen consequtive points according the order in tsp plt.plot([x[tsp[i],0], x[tsp[i+1],0]] , [x[tsp[i],1], x[tsp[i+1],1]], 'k-') plt.title("The TSP graph") plt.show()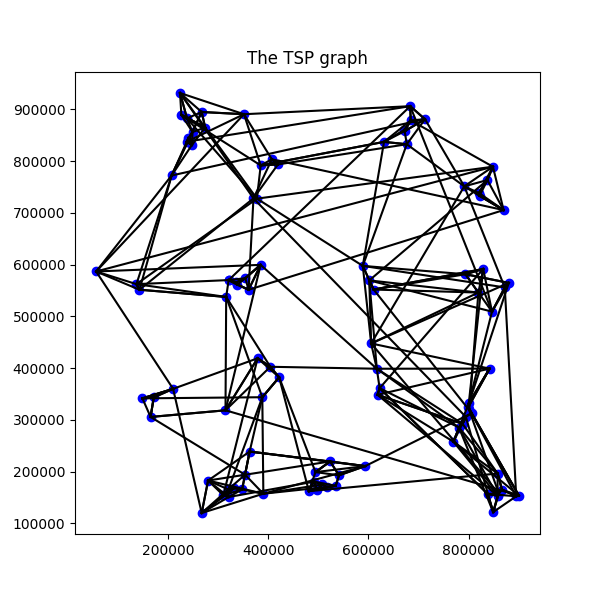
make clean make Cluster vectorial (numerical) S1 dataset (data/s1.txt) to 15 clusters:
./tspg data/s1.txt --type vec -T 10 -C 15 --algo tspgclu -o tmp/s1part.txt --cfn tmp/centroids.txt ./tspg data/birkbeckU.txt --type txt -T 10 -C 20 --algo tspgclu --dfun lev -o tmp/birkbeckU_part.txt -H ./show_text_clusters.rb data/birkbeckU.txt tmp/birkbeckU_part.txt > tmp/text_clu.html