Streamlit is an open-source Python library for creating web applications for data science and machine learning projects. It's designed to be used by data scientists and machine learning engineers who do not have extensive front-end development skills. It has a simple syntax allowing you to create interactive web apps with a few lines of code.
By encapsulating complex technical details behind a user-friendly interface, Streamlit allows users to focus on exploring and presenting their data, prototypes, or models in real-time. This makes it a valuable tool for quickly sharing insights.
Installing the Streamlit Library
Create a new virtual environment. This will ensure there is no package version conflict after installing Streamlit. Then use pip to install Streamlit by running the following command:
pip install streamlit
Then, verify the installation is installed correctly.
streamlit --version
If the installation is successful, the installed Streamlit version will display.
Building a Simple Data Cleaning and Analysis App
You will create a simple web application to learn how Streamlit works and its features. This application will be able to clean an uploaded dataset, perform data analysis, and finally visualize the data.
The full source code is available in a GitHub repository.
Installing and Importing the Necessary Libraries
Start by installing Pandas, Matplotlib, and Seaborn in the same virtual environment you installed Streamlit using the following command:
pip install pandas matplotlib seaborn
Then create a new Python script and import all the installed libraries.
 import streamlit as st
import pandas as pd
import matplotlib.pyplot as plt
import seaborn as sns
This will enable you to use their functionalities in your code.
Uploading a Dataset and Displaying Its Contents
Then define a function that will read an uploaded dataset. It will then return a DataFrame if the read operation is successful. If not, it will display an error message in the sidebar. The error occurs when the file is not a valid CSV file.
 def load_data(uploaded_file):
   try:
       df = pd.read_csv(uploaded_file)
       return df
   except Exception as e:
       st.sidebar.error('Error occurred while loading the file.'
                        ' Please make sure it is a valid CSV file.')
       return None
Define another function that will use Steamlit to display the DataFrame in a tabular format. It will only do this when the user checks the Show Raw Data checkbox. It will utilize Streamlit's checkbox, dataframe, and subheader functions.
 def explore_raw_data(df):
   st.subheader('Raw Data')
   if st.checkbox('Show Raw Data'):
       st.dataframe(df)
Having created the DataFrame and shown raw data, you now need to clean the data, analyze it, and finally visualize it.
Performing Data Cleaning
Start by defining a function that will perform data cleaning. This function will handle missing values in the DataFrame and duplicate rows. The cleaned DataFrame is then shown to the user using st.dataframe function if they check the Show Cleaned Data checkbox.
 def data_cleaning(df):
   st.header('Data Cleaning')

   # Remove Missing Values
   st.subheader('Handling Missing Values')
   df.dropna(inplace=True)
   st.write("Missing values removed from the dataset.")

   # Remove Duplicate Rows
   st.subheader('Removing Duplicate Rows')
   initial_rows = len(df)
   df.drop_duplicates(inplace=True)
   final_rows = len(df)
   st.write(f"Removed {initial_rows - final_rows} duplicate rows.")

   if st.checkbox('Show Cleaned Data'):
       st.dataframe(df)
The function also shows the number of removed duplicate rows.
Performing Data Analysis
Define a data analysis function. This function will show descriptive statistics of the DataFrame and display the correlation matrix heatmap. It will utilize the st.pyplot function to display the heatmap on the user interface.
 def data_analysis(df):
   st.header('Data Analysis')

   # Descriptive Statistics
   st.subheader('Descriptive Statistics')
   st.write(df.describe())

   # Correlation Matrix
   st.subheader('Correlation Matrix')
   corr_matrix = df.corr()
   fig, ax = plt.subplots(figsize=(10, 8))
   sns.heatmap(corr_matrix, annot=True, cmap='coolwarm',
               center=0, ax=ax)
   st.pyplot(fig)
You can modify the above function to perform more data analysis. This will help you derive more insights from your data.
Performing Data Visualization
Data visualization is one of the crucial functionalities of the application. This is because it gives an insight into the data visually in a human-friendly manner. This functionality should therefore allow the users to change the look of the plots.
To accomplish this, create a function that will allow users to select a column, set the number of bins, and pick a color for the histogram. It will then generate a histogram and a box plot and displays them using st.pyplot function.
 def data_visualization(df):
   st.header('Data Visualization')

   # Histogram
   st.subheader('Histogram')
   selected_column = st.selectbox("Select a column to visualize:",
                                  df.columns)
   num_bins = st.slider("Select number of bins:",
                        min_value=5, max_value=50, value=20)
   plot_color = st.color_picker("Select histogram color", "#1f77b4")
   plt.figure(figsize=(8, 6))
   plt.hist(df[selected_column], bins=num_bins, edgecolor='black',
            color=plot_color, alpha=0.7)
   plt.xlabel(selected_column)
   plt.ylabel('Frequency')
   st.pyplot(plt)

   # Box Plot
   st.subheader('Box Plot')
   selected_column = st.selectbox("Select a column for box plot:",
                                  df.columns)
   plot_color = st.color_picker("Select box plot color", "#1f77b4")
   plt.figure(figsize=(8, 6))
   sns.boxplot(x=df[selected_column], color=plot_color)
   plt.xlabel(selected_column)
   plt.ylabel('Value')
   st.pyplot(plt)
By now you have all the core functionalities of the app.
Collecting the Users’ Feedback
Sometimes, a functionality may not work as expected. You then need a way for the users to submit their feedback. One way is by the users reaching you through an email. Streamlit provides the interface to collect the user's feedback but does not provide built-in functionality to send emails directly. However, you can integrate external libraries or services to send emails from your app.
To collect the user's feedback, define a function to present the user with a form.
 def feedback_form():
   st.header('Feedback')
   with st.form('Feedback Form'):
       email = st.text_input("Your Email")
       feedback = st.text_area("Feedback")
       submitted = st.form_submit_button("Submit Feedback")
       if submitted:
           # Here, you can send the feedback to the developer's
           # email using external services/APIs
           st.success("Thank you for your feedback!")
This form will collect the user's email and feedback and send it to you through an email.
Controlling the Flow of Your Program and Running the App
Lastly, you need a main function that will put all these functions together and control the flow of the program. This function will also ensure the users agree to your data privacy terms before the application processes their uploaded dataset.
 def main():
   st.title('Data Cleaning, Analysis, and Visualization App')

   st.sidebar.header('Upload Dataset')
   uploaded_file = st.sidebar.file_uploader('Upload a CSV file', type=['csv'])

   agree_terms = st.sidebar.checkbox("I agree to the terms")

   if uploaded_file is not None and agree_terms:
       df = load_data(uploaded_file)

       if df is not None:
           explore_raw_data(df)
           data_cleaning(df)
           data_analysis(df)
           data_visualization(df)

           feedback_form()
You can run your program run independently or import it as a module using the if __name__ == '__main__': construct.
 if __name__ == '__main__':
   main()
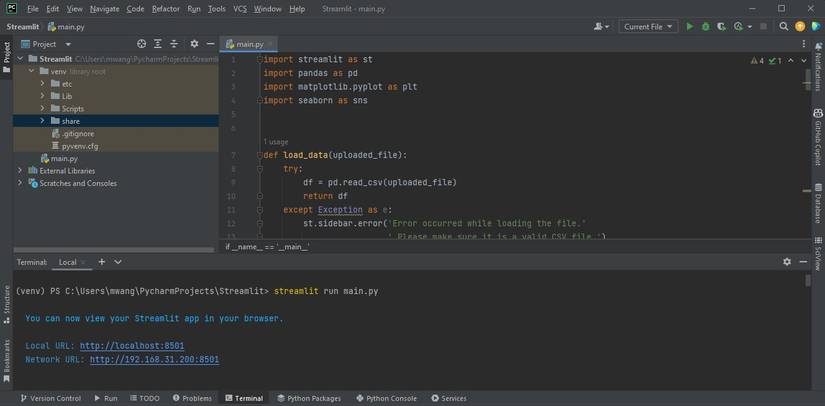
Proceed to the terminal and navigate to the path in which your project resides. Then run the following command to start the app:
streamlit run main.py
Replace main.py with the actual name of your script. After running the command Streamlit will generate a Local URL and a Network URL. You can use any of these URLs to interact with your app.
The output of the program is as follows:
Creating interactive web apps for data science has never been easier. You do not need advanced web development skills to create a user interface for your application.
Should You Still Learn Web Development?
It depends on your specific goals. If you anticipate building complex, feature-rich web applications that require extensive user interface design and advanced functionalities, then learning web development technologies could be beneficial. This is because in Streamlit you have limited control over the fine-grained customization of your app's appearance and behavior.


