In this brief write-up, I demonstrate how to build a working pipeline to ingest Kafka records into CockroachDB via Kafka Connect's JDBC Sink Connector, locally, using Docker.
This serves as functional testing, that is, for understanding the concepts and all moving parts before moving on to performance testing, on real Production grade clusters.
Stay tuned for a follow-up blog where we will use this content to build and run a performance test.
UPDATE: performance test is here!
Setup
Save below as file kafka2crdb.yaml.
# kafka2crdb.yaml --- version: '2' services: zookeeper: image: confluentinc/cp-zookeeper:7.3.0 hostname: zookeeper container_name: zookeeper ports: - 2181:2181 environment: ZOOKEEPER_CLIENT_PORT: 2181 ZOOKEEPER_TICK_TIME: 2000 broker: image: confluentinc/cp-server:7.3.0 hostname: broker container_name: broker depends_on: - zookeeper ports: - 9092:9092 - 9101:9101 environment: KAFKA_BROKER_ID: 1 KAFKA_ZOOKEEPER_CONNECT: 'zookeeper:2181' KAFKA_LISTENER_SECURITY_PROTOCOL_MAP: PLAINTEXT:PLAINTEXT,PLAINTEXT_HOST:PLAINTEXT KAFKA_ADVERTISED_LISTENERS: PLAINTEXT://broker:29092,PLAINTEXT_HOST://localhost:9092 KAFKA_METRIC_REPORTERS: io.confluent.metrics.reporter.ConfluentMetricsReporter KAFKA_OFFSETS_TOPIC_REPLICATION_FACTOR: 1 KAFKA_GROUP_INITIAL_REBALANCE_DELAY_MS: 0 KAFKA_CONFLUENT_LICENSE_TOPIC_REPLICATION_FACTOR: 1 KAFKA_CONFLUENT_BALANCER_TOPIC_REPLICATION_FACTOR: 1 KAFKA_TRANSACTION_STATE_LOG_MIN_ISR: 1 KAFKA_TRANSACTION_STATE_LOG_REPLICATION_FACTOR: 1 KAFKA_JMX_PORT: 9101 KAFKA_JMX_HOSTNAME: localhost KAFKA_CONFLUENT_SCHEMA_REGISTRY_URL: http://schema-registry:8081 CONFLUENT_METRICS_REPORTER_BOOTSTRAP_SERVERS: broker:29092 CONFLUENT_METRICS_REPORTER_TOPIC_REPLICAS: 1 CONFLUENT_METRICS_ENABLE: 'true' CONFLUENT_SUPPORT_CUSTOMER_ID: 'anonymous' schema-registry: image: confluentinc/cp-schema-registry:7.3.0 hostname: schema-registry container_name: schema-registry depends_on: - broker ports: - 8081:8081 environment: SCHEMA_REGISTRY_HOST_NAME: schema-registry SCHEMA_REGISTRY_KAFKASTORE_BOOTSTRAP_SERVERS: 'broker:29092' SCHEMA_REGISTRY_LISTENERS: http://0.0.0.0:8081 kafka-connect: image: cnfldemos/cp-server-connect-datagen:0.6.0-7.3.0 hostname: connect container_name: connect depends_on: - broker - schema-registry ports: - 8083:8083 environment: CONNECT_BOOTSTRAP_SERVERS: 'broker:29092' CONNECT_REST_ADVERTISED_HOST_NAME: connect CONNECT_GROUP_ID: compose-connect-group CONNECT_CONFIG_STORAGE_TOPIC: docker-connect-configs CONNECT_CONFIG_STORAGE_REPLICATION_FACTOR: 1 CONNECT_OFFSET_FLUSH_INTERVAL_MS: 10000 CONNECT_OFFSET_STORAGE_TOPIC: docker-connect-offsets CONNECT_OFFSET_STORAGE_REPLICATION_FACTOR: 1 CONNECT_STATUS_STORAGE_TOPIC: docker-connect-status CONNECT_STATUS_STORAGE_REPLICATION_FACTOR: 1 CONNECT_KEY_CONVERTER: org.apache.kafka.connect.storage.StringConverter CONNECT_VALUE_CONVERTER: io.confluent.connect.avro.AvroConverter CONNECT_VALUE_CONVERTER_SCHEMA_REGISTRY_URL: http://schema-registry:8081 CLASSPATH: /usr/share/java/monitoring-interceptors/monitoring-interceptors-7.3.0.jar CONNECT_PRODUCER_INTERCEPTOR_CLASSES: "io.confluent.monitoring.clients.interceptor.MonitoringProducerInterceptor" CONNECT_CONSUMER_INTERCEPTOR_CLASSES: "io.confluent.monitoring.clients.interceptor.MonitoringConsumerInterceptor" CONNECT_PLUGIN_PATH: "/usr/share/java,/usr/share/confluent-hub-components" CONNECT_LOG4J_LOGGERS: org.apache.zookeeper=ERROR,org.I0Itec.zkclient=ERROR,org.reflections=ERROR command: - bash - -c - | # Installing connector plugin confluent-hub install --no-prompt confluentinc/kafka-connect-jdbc:latest # Downloading newer Postgres JDBC driver cd /usr/share/confluent-hub-components/confluentinc-kafka-connect-jdbc/lib rm -rf postgresql* wget https://jdbc.postgresql.org/download/postgresql-42.5.0.jar # Launching Kafka Connect worker /etc/confluent/docker/run & sleep infinity control-center: image: confluentinc/cp-enterprise-control-center:7.3.0 hostname: control-center container_name: control-center depends_on: - broker - schema-registry - kafka-connect ports: - 9021:9021 environment: CONTROL_CENTER_BOOTSTRAP_SERVERS: 'broker:29092' CONTROL_CENTER_CONNECT_CONNECT-DEFAULT_CLUSTER: 'connect:8083' CONTROL_CENTER_KSQL_KSQLDB1_URL: "http://ksqldb-server:8088" CONTROL_CENTER_KSQL_KSQLDB1_ADVERTISED_URL: "http://localhost:8088" CONTROL_CENTER_SCHEMA_REGISTRY_URL: "http://schema-registry:8081" CONTROL_CENTER_REPLICATION_FACTOR: 1 CONTROL_CENTER_INTERNAL_TOPICS_PARTITIONS: 1 CONTROL_CENTER_MONITORING_INTERCEPTOR_TOPIC_PARTITIONS: 1 CONFLUENT_METRICS_TOPIC_REPLICATION: 1 PORT: 9021 cockroach: image: cockroachdb/cockroach:latest container_name: cockroach-1 command: start-single-node --insecure ports: - 26257:26257 - 8080:8080 Notice in the kafka-connect definition how we're installing the latest version of the JDBC Sink Connector and update the JDBC Postgresql driver.
Bring the Docker Compose up.
Note:
You might have to tweak your Docker env to allow for more resources.
I use Docker Desktop for macOS configured with 12 CPUs and 22GB Memory.
docker-compose -f kafka2crdb.yaml up -d Make sure everything is up and running
$ docker-compose -f kafka2crdb.yaml ps NAME COMMAND SERVICE STATUS PORTS broker "/etc/confluent/dock…" broker running 0.0.0.0:9092->9092/tcp, 0.0.0.0:9101->9101/tcp cockroach-1 "/cockroach/cockroac…" cockroach running 0.0.0.0:8080->8080/tcp, 0.0.0.0:26257->26257/tcp connect "bash -c '# Installi…" kafka-connect running 0.0.0.0:8083->8083/tcp, 9092/tcp control-center "/etc/confluent/dock…" control-center running 0.0.0.0:9021->9021/tcp schema-registry "/etc/confluent/dock…" schema-registry running 0.0.0.0:8081->8081/tcp zookeeper "/etc/confluent/dock…" zookeeper running 2888/tcp, 0.0.0.0:2181->2181/tcp, 3888/tcp Open the Control Center at http://localhost:9021 and wait until the broker shows up as healthy.
Open another tab for the CockroachDB Console at http://localhost:8080.
Demo
We create the below pipeline:
datagen(source) --> Kafka Topic --> Kafka JDBC Sink Connector --> CockroachDB(target)
You can do most of below tasks from within the Control Center.
Create Kafka topic
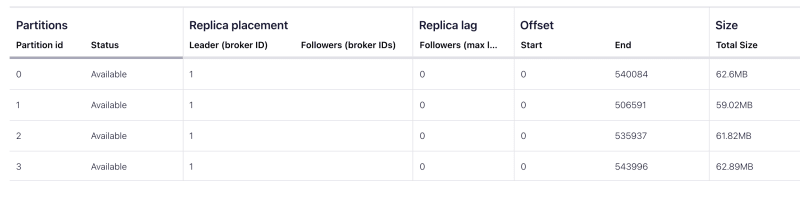
Connect to the broker container, and create a topic transactions with 4 partitions
docker exec -it broker /bin/bash Once in the broker shell
# $ create topic with 4 partitions kafka-topics --bootstrap-server broker:9092 --create --topic transactions --partitions 4 # describe it $ kafka-topics --bootstrap-server broker:9092 --topic transactions --describe Topic: transactions TopicId: F6NF00Z8Ry2xIWnbYVF9vg PartitionCount: 4 ReplicationFactor: 1 Configs: Topic: transactions Partition: 0 Leader: 1 Replicas: 1 Isr: 1 Offline: Topic: transactions Partition: 1 Leader: 1 Replicas: 1 Isr: 1 Offline: Topic: transactions Partition: 2 Leader: 1 Replicas: 1 Isr: 1 Offline: Topic: transactions Partition: 3 Leader: 1 Replicas: 1 Isr: 1 Offline: With the topic partitioned into 4, we can have an equal amount of consumer processes, or tasks, consuming from the topic and ingesting into CockroachDB, in parallel.
All set, now we are ready to ingest data into this topic.
Configure the Source Connector
Our source will be a built-in data generator.
Open a new terminal, and create the Datagen Connector.
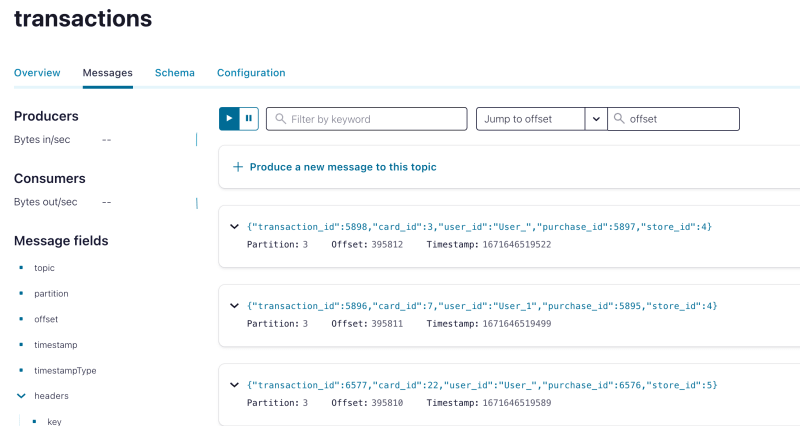
# the datagen-connect container listens on port 8083 curl -s -X POST http://localhost:8083/connectors/ \ -H "Content-Type: application/json" -d '{ "name": "datagen-transactions", "config": { "connector.class": "io.confluent.kafka.connect.datagen.DatagenConnector", "key.converter": "org.apache.kafka.connect.storage.StringConverter", "kafka.topic": "transactions", "tasks.max": "64", "max.interval": "100", "quickstart": "transactions" } }' | jq '.' Confirm in the Control Center that messages are getting generated by visiting the Topics section.
Check also on the Messages and Schema tabs to see what the records look like
Configure the Sink Connector
We're ready to setup the JDBC Sink Connector to ingest data into CockroachDB.
Note how we set batch.size the same as max.poll.records to make sure 1 transaction includes only 128 records.
Because we've set reWriteBatchedInserts=true, the JDBC Postgres driver will conflate the 128 individual INSERT statements into a single, multi-record INSERT statement.
Note however that this single statement transaction is still an explicit transaction.
Note:
I've re-built the connector set with autocommit=true to leverage implicit transactions.
I have therefore replaced the original filekafka-connect-jdbc-10.6.1.jarin/usr/share/confluent-hub-components/confluentinc-kafka-connect-jdbc/lib/with my custom build JAR file.
Below screenshots show the results from using this custom build.
We also set tasks.max=4 to have 4 consumer processes reading from the 4 topic partitions and ingesting data into CockroachDB in parallel. Each task creates its own database connection and reads from a specific topic partition.
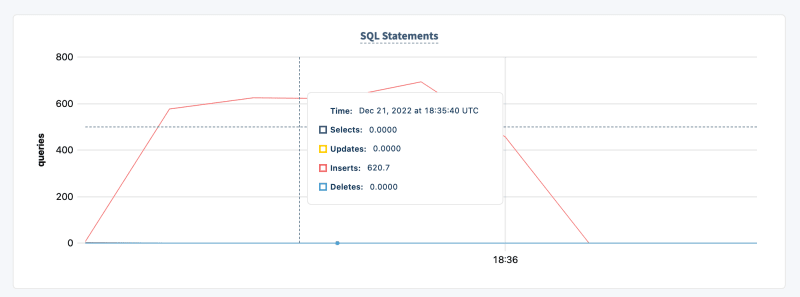
# register the connector curl -s -X POST http://localhost:8083/connectors/ \ -H "Content-Type: application/json" -d '{ "name": "sink-crdb", "config": { "connector.class": "io.confluent.connect.jdbc.JdbcSinkConnector", "connection.url": "jdbc:postgresql://cockroach-1:26257/defaultdb?reWriteBatchedInserts=true&ApplicationName=txns", "topics": "transactions", "tasks.max": "4", "key.converter": "org.apache.kafka.connect.storage.StringConverter", "value.converter": "io.confluent.connect.avro.AvroConverter", "value.converter.schema.registry.url": "http://schema-registry:8081", "connection.user": "root", "connection.password": "", "auto.create": true, "auto.evolve": true, "insert.mode": "insert", "pk.mode": "none", "pk.fields": "none", "batch.size": 128, "consumer.override.max.poll.records": 128 } }' | jq '.' You should see now 4 active SQL connections established to CockroachDB, and activity on the SQL Statement chart
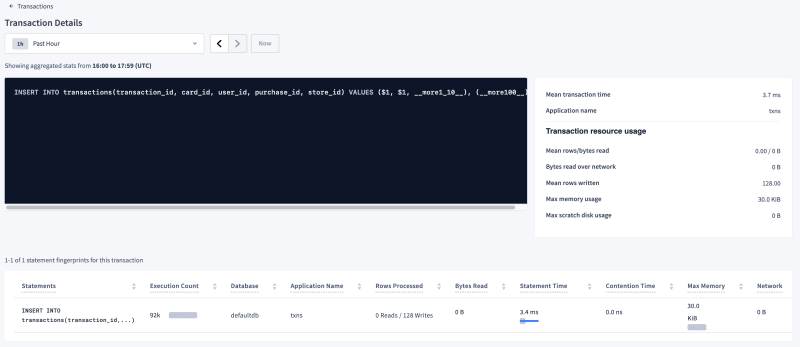
Here, in CockroachDB Console in the SQL Activity > Transaction page, we confirm each transaction writes 128 rows.
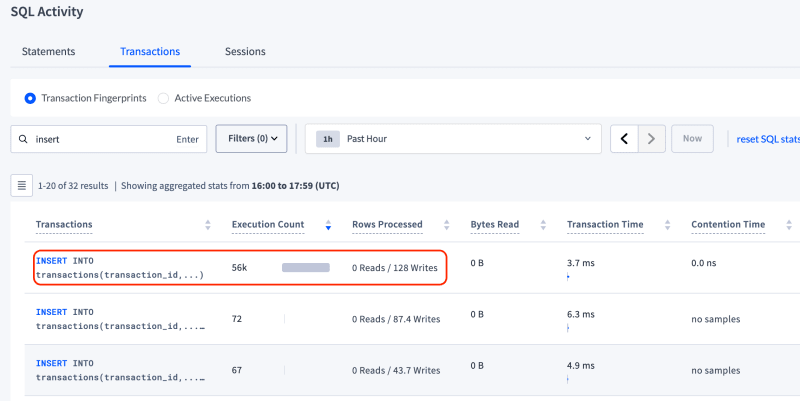
Drilling down into the transaction, we can see of how many statements it is composed. In this case, as expected, it is just 1 INSERT statement
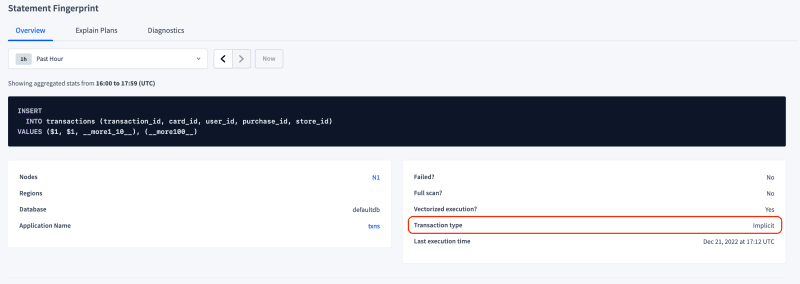
Further drilling down into the Statement itself, we can see this is a multi-record INSERT statements with 128 records, executed as an implicit transaction.
Query data in CockroachDB
Open a SQL prompt
docker exec -it cockroach-1 cockroach sql --insecure -- the table was automatically created by the Kafka JDBC Sink Connector -- this behavior is of course configurable > SHOW TABLES; schema_name | table_name | type | owner | estimated_row_count | locality --------------+--------------+-------+-------+---------------------+----------- public | transactions | table | root | 0 | NULL -- check the schema of the created table -- note how CockroachDB created its own Primary Key -- this is also configurable > SHOW CREATE transactions; table_name | create_statement ---------------+-------------------------------------------------------------- transactions | CREATE TABLE public.transactions ( | transaction_id INT8 NOT NULL, | card_id INT8 NOT NULL, | user_id STRING NOT NULL, | purchase_id INT8 NOT NULL, | store_id INT8 NOT NULL, | rowid INT8 NOT VISIBLE NOT NULL DEFAULT unique_rowid(), | CONSTRAINT transactions_pkey PRIMARY KEY (rowid ASC) | ) -- inspect few rows > SELECT * FROM transactions LIMIT 5; transaction_id | card_id | user_id | purchase_id | store_id -----------------+---------+---------+-------------+----------- 1 | 7 | User_6 | 0 | 1 1 | 19 | User_7 | 0 | 6 1 | 18 | User_5 | 0 | 6 1 | 6 | User_ | 0 | 3 1 | 13 | User_ | 0 | 3 -- avoid contention by using AS OF SYSTEM TIME when running large aggregate queries > SELECT count(*) FROM transactions AS OF SYSTEM TIME '-5s'; count ---------- 594633 -- wait few seconds, then query again to see count increasing... > SELECT count(*) FROM transactions AS OF SYSTEM TIME '-5s'; count ---------- 594992 You can view more metrics and statement statistics on the DB Console, at http://localhost:8080.
Clean up
Bring down and remove all containers with
docker-compose -f kafka2crdb.yaml down 
Top comments (0)